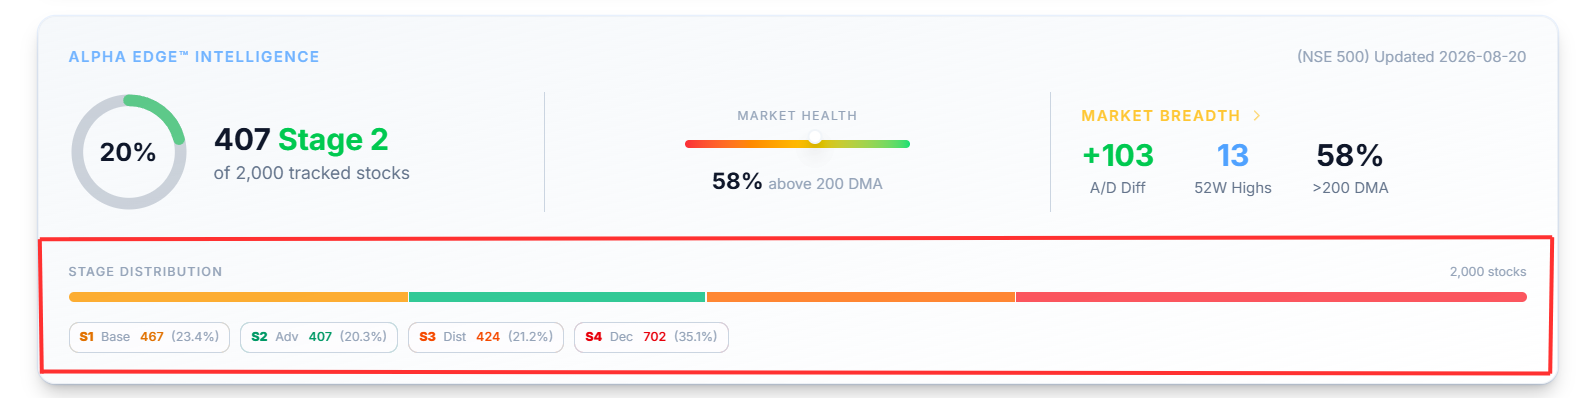
The Alpha Edge Intelligence Panel
A four-part summary of Stage 2 count, market health, breadth, and stage distribution.
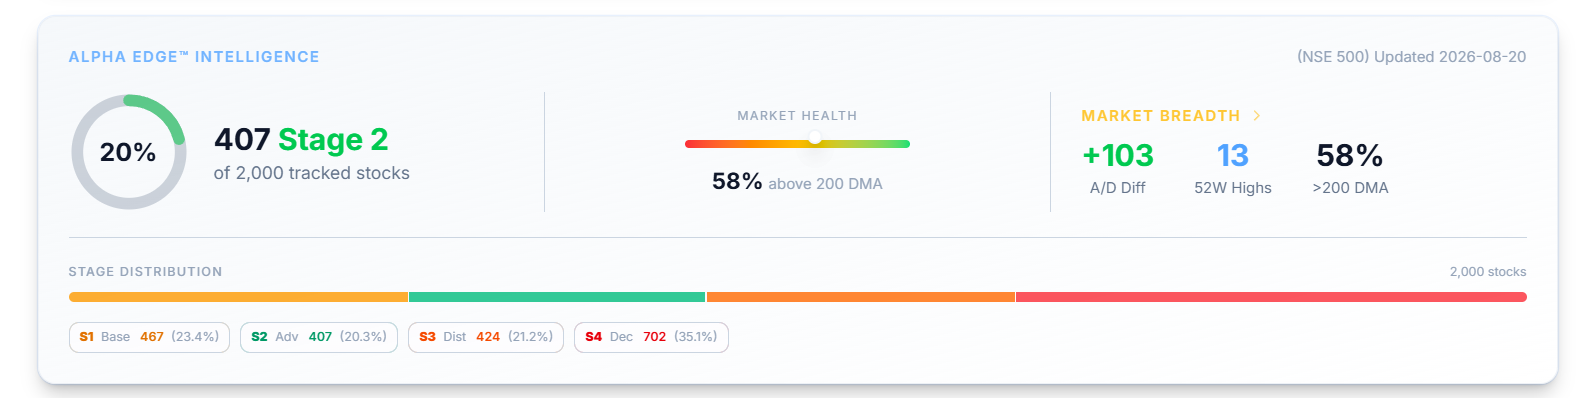
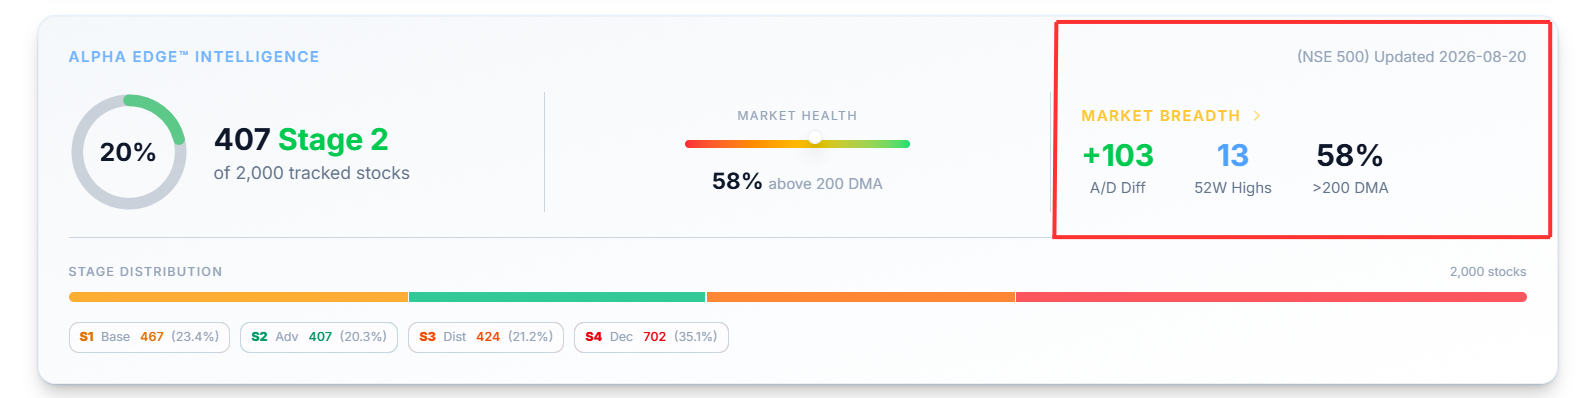
This panel summarizes the whole market in four pieces — how many stocks are in Stage 2, overall market health, breadth stats, and the current stage distribution — so you can take the market's temperature before you dig into anything specific.
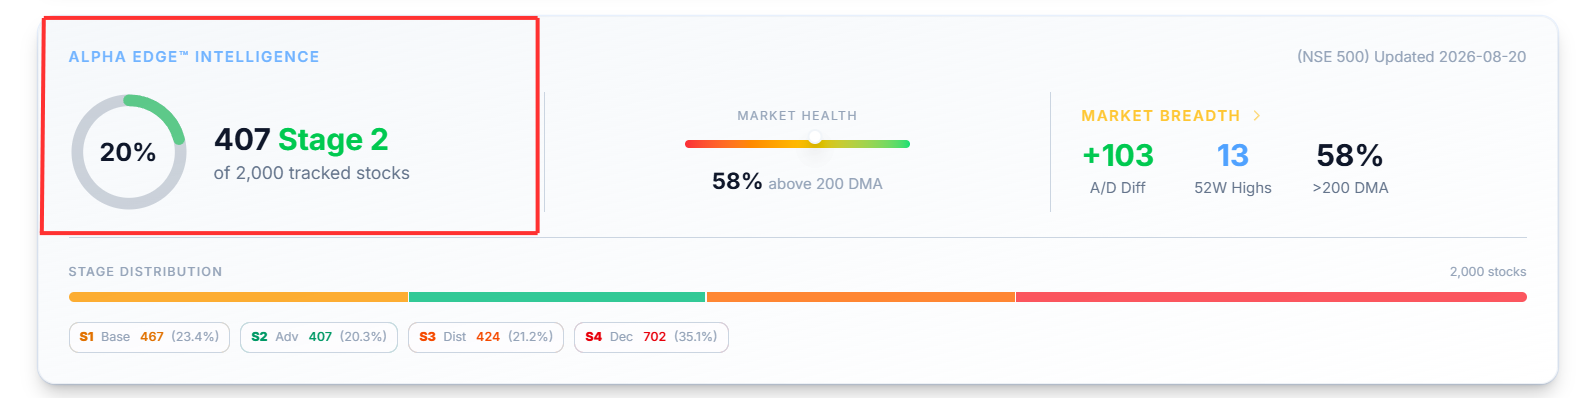
Stage 2 Gauge
Shows how many stocks are currently in Stage 2 out of all tracked stocks, as both a count and a percentage.
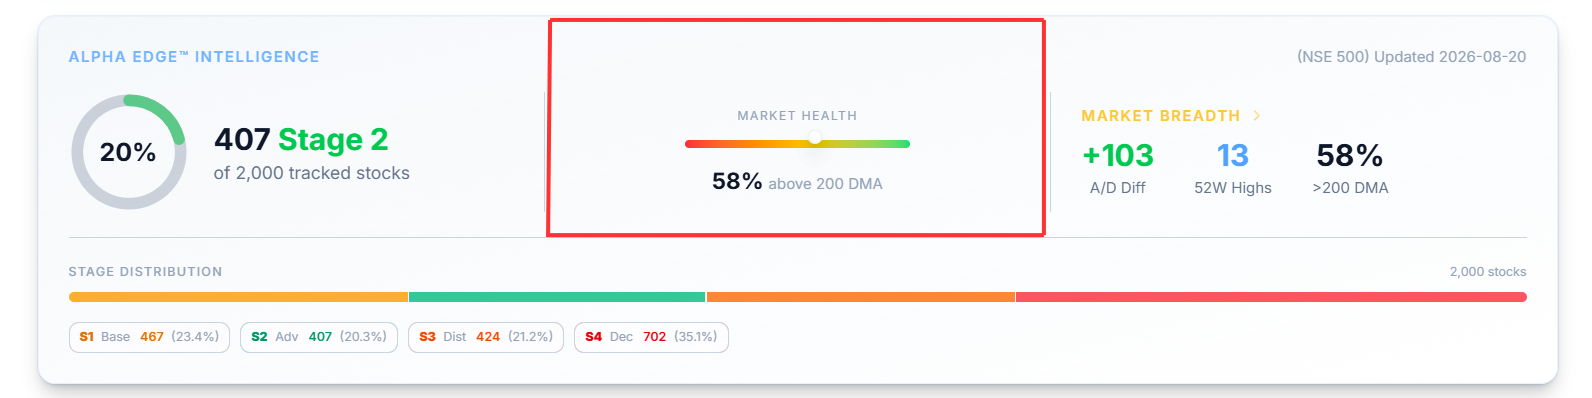
Market Health Gauge
Shows the percentage of stocks trading above their 200-day moving average, on a scale from weak to strong. A reading below 40% signals a weak market, while a reading above signals broad participation and stronger markets.
Market Breadth Daily Stats
Shows the daily Advance-Decline for Nifty 500 stocks, the count for New 52-Week Highs today, and the percentage of stocks above the 200 DMA — a condensed version of the full Market Breadth screen.
For more details, you can click on these stats and go to the Market Breadth Screen.
Stage Distribution Bar
Shows what share of all tracked stocks currently sit in each stage — Stage 1 or Base, Stage 2 or Advancing, Stage 3 or Distribution, and Stage 4 or Decline.
To view the stocks in a particular stage, select it — this takes you to the Stock List at the Stage Screen.