Build Your Own Dashboard
A customizable home screen built from widgets you choose.
WealthLab tracks a lot of data across a lot of screens. Your Dashboard lets you pull your favorite data points onto one screen, that you can arrange exactly the way you want, so it feels like it was built just for you.
WealthLab offers more than 30 widgets across stocks, industries, indices, market health, portfolio tracking, and more, than you can personalise and use in upto 15 dashboard screens.
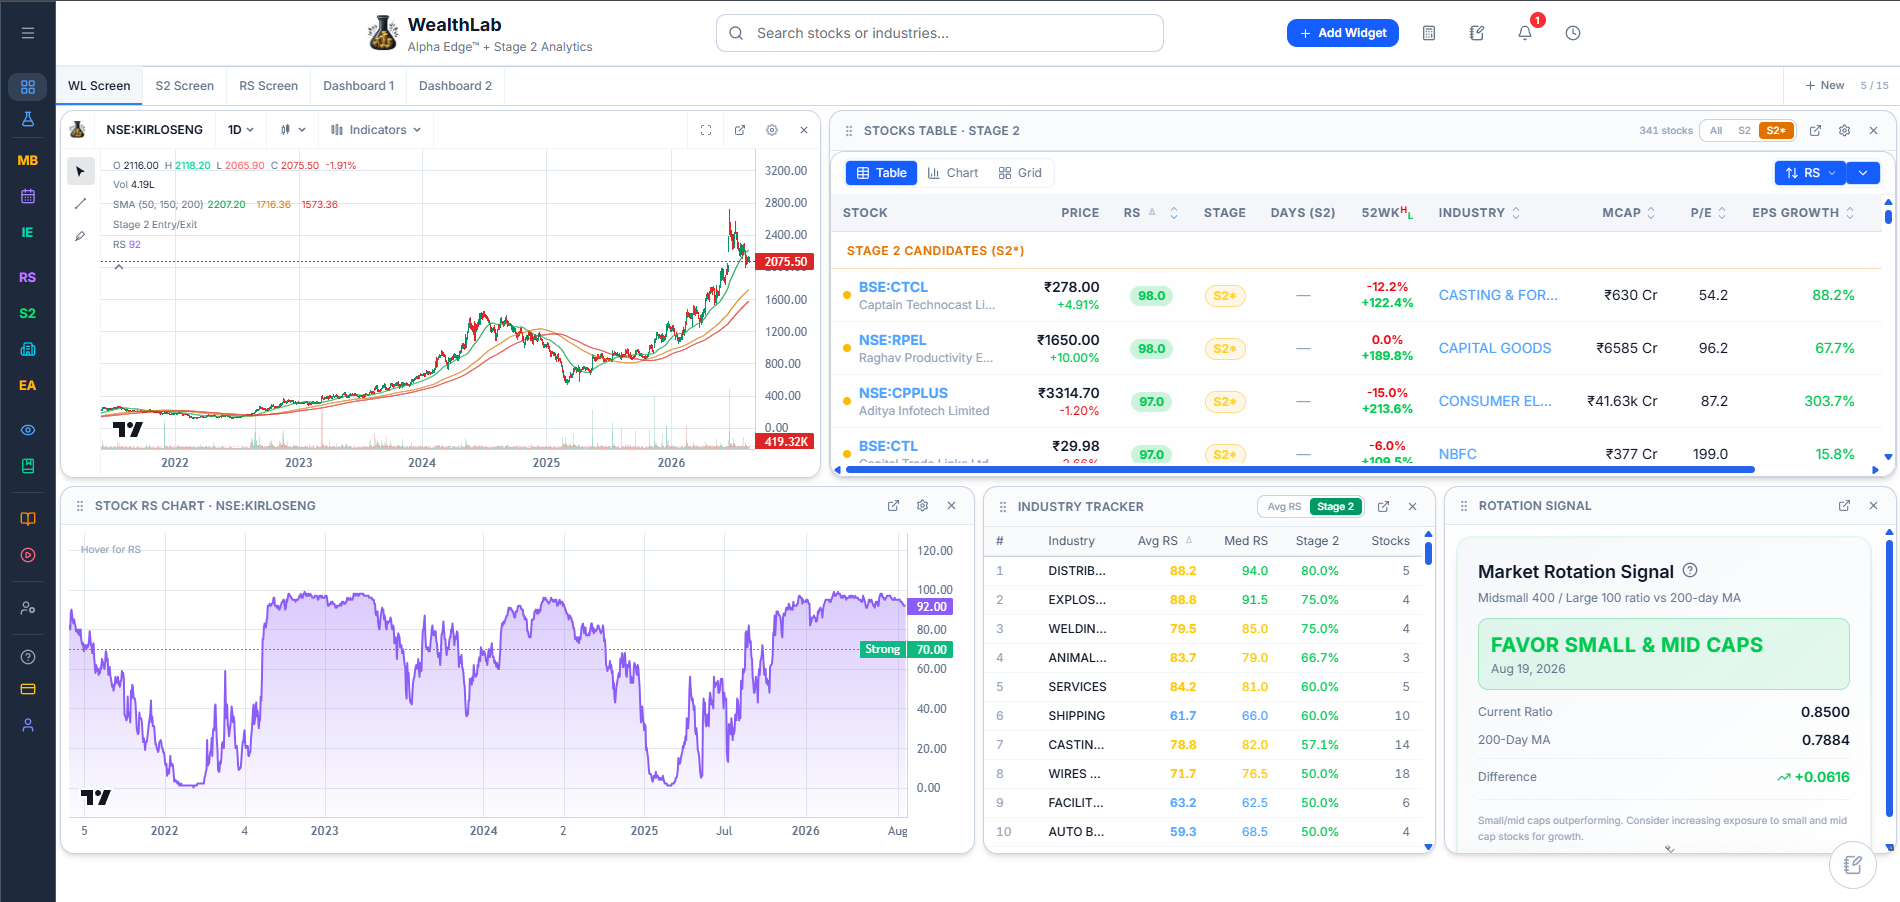
Your Three Starting Dashboards
At WealthLab, we have three ready-made dashboards, each built around a different way of looking at the market. The WL Screen is a general overview of leadership and market health, the S2 Screen is focused on Stage 2, and the RS Screen is focused on relative strength, with a price chart, Stock RS Movers (Winners and Losers), and a Fundamentals panel.
These pre-built dashboards are to assist you to get started with your research. But you can and should create your own workflow.
What Each Widget Shows
Every widget in the library comes with its own description right inside the Add Widget menu — so you can see exactly what a widget shows before adding it, without leaving your screen.
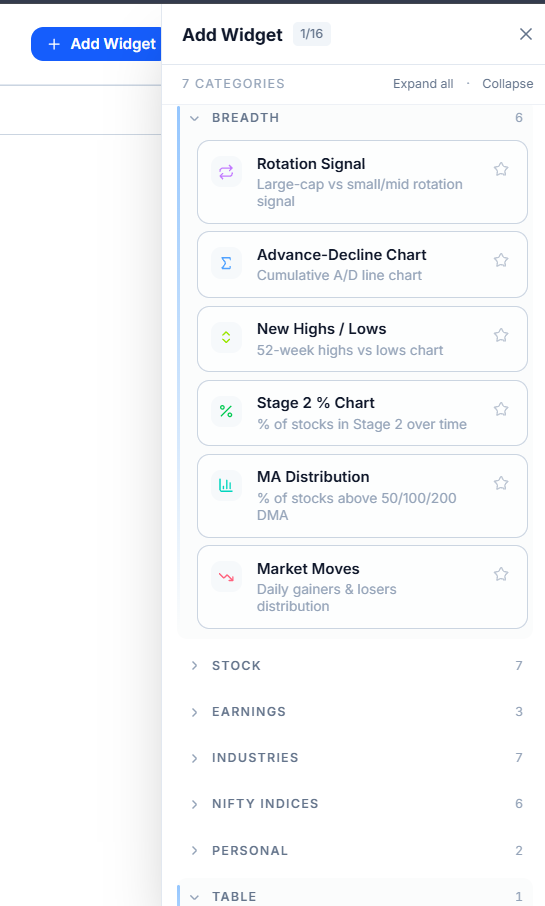
Where Widget Data Comes From
The widgets are the same data points that you see across the various pages on WealthLab, ranging from Relative Strength Industries, to Market Breadth tables. The widget library has something for every screen in WealthLab.
Common Questions
Are the widgets synced?
Yes — clicking a stock in one widget, like the Stocks Table, updates the chart and Fundamentals panel on that screen to the same stock.
Related Articles
Add, Remove, and Rearrange Widgets · Create Multiple Dashboards