India High Frequency Macro Data
Monthly indicators across Consumption, Industry, Services, Fiscal, Monetary, External, and Flows.
India High Frequency Macro Data pulls together monthly, high-frequency indicators across seven key areas of the economy, so that you're aware of the current state of the demand-supply situation across various segments of the economy.
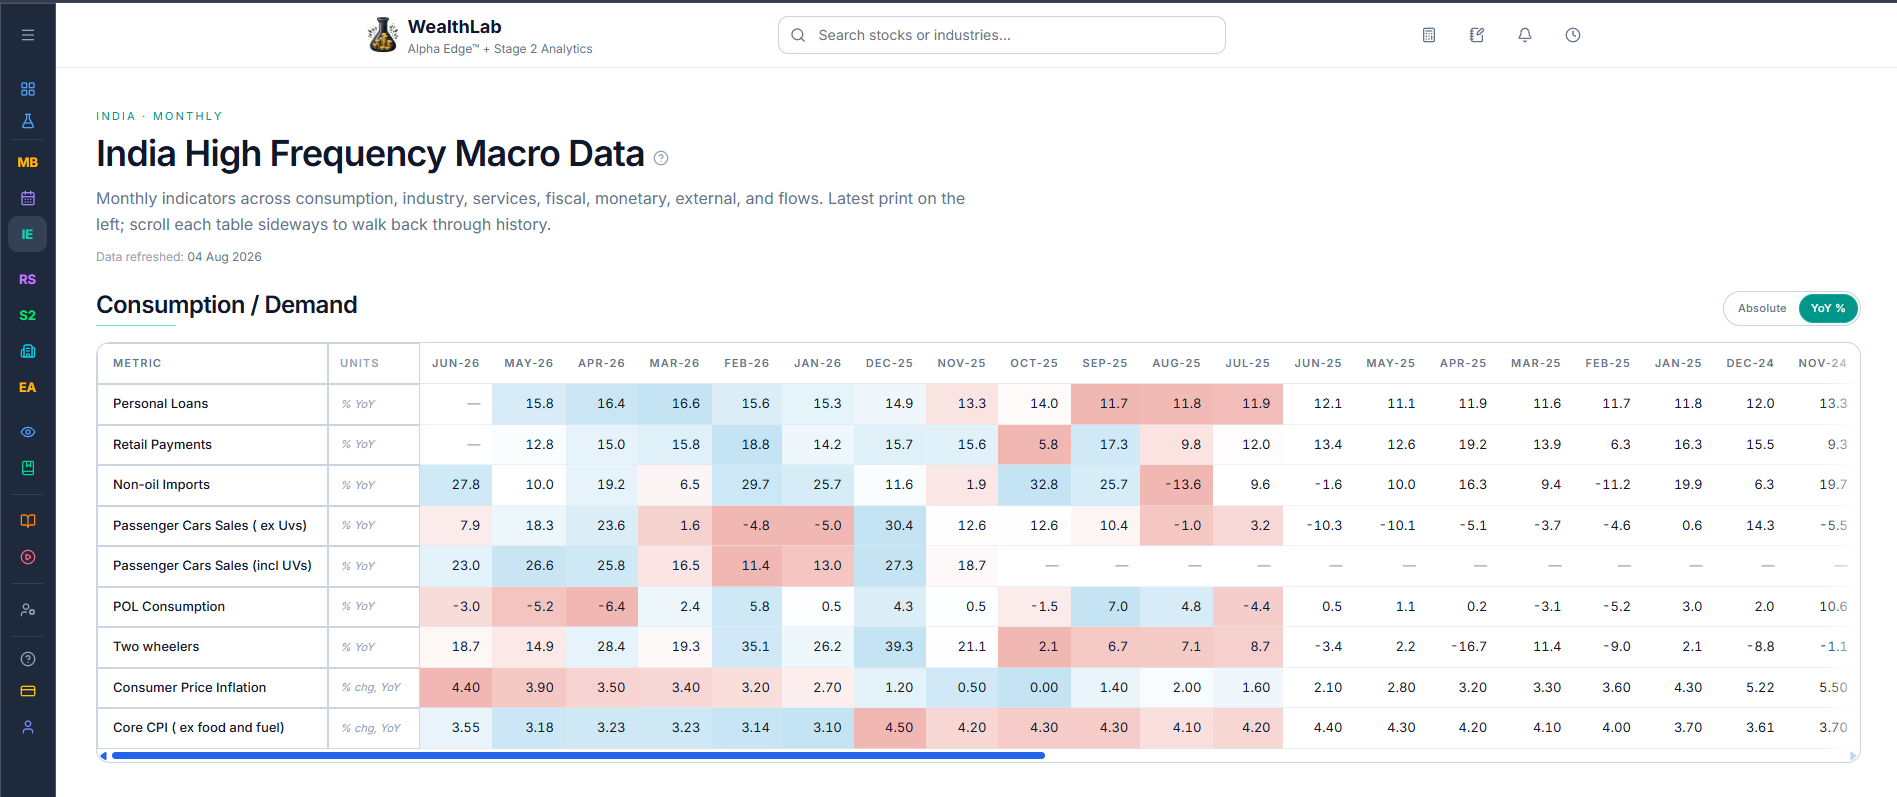
Why "High-Frequency" Matters?
A lot of the economic data that shapes headlines is only published quarterly or annually — useful, but slow.
High-frequency indicators get reported monthly like credit growth, PMI surveys, toll collections, and vehicle sales.
None of these individually tells the whole story of the economy, but taken together, they give you a much earlier signal of where things are heading than waiting for the next quarterly GDP release.
What Are the Seven Key Areas?
Consumption / Demand — tracks things like personal loans, retail payments, and vehicle sales. This is your read on how much money is actually moving through the economy at the household level, and it tends to move before broader growth numbers catch up to it.
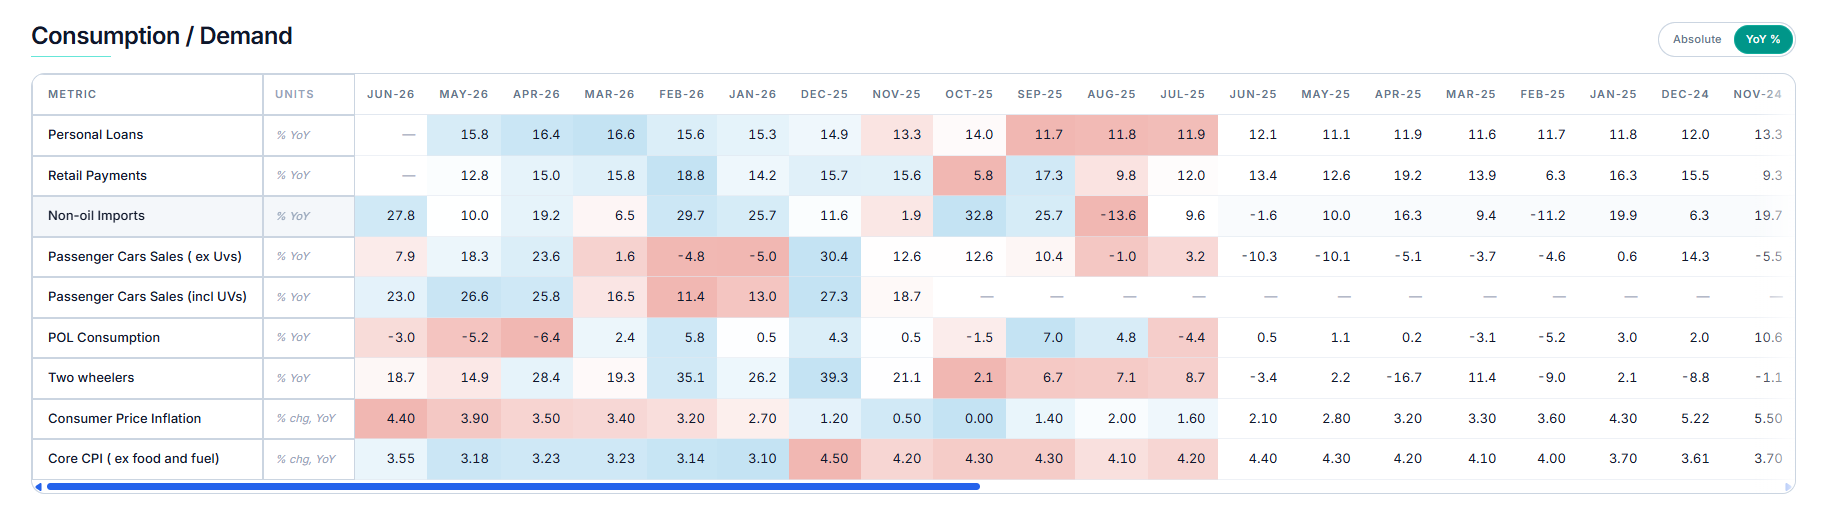
Industry / Manufacturing — tracks production-side indicators like cement and steel output, industrial production, and manufacturing PMI. Where Consumption shows what's being bought, this shows what's being made, and factories usually ramp production up or down ahead of consumer spending actually shifting — which is why this often signals a change before Consumption does.
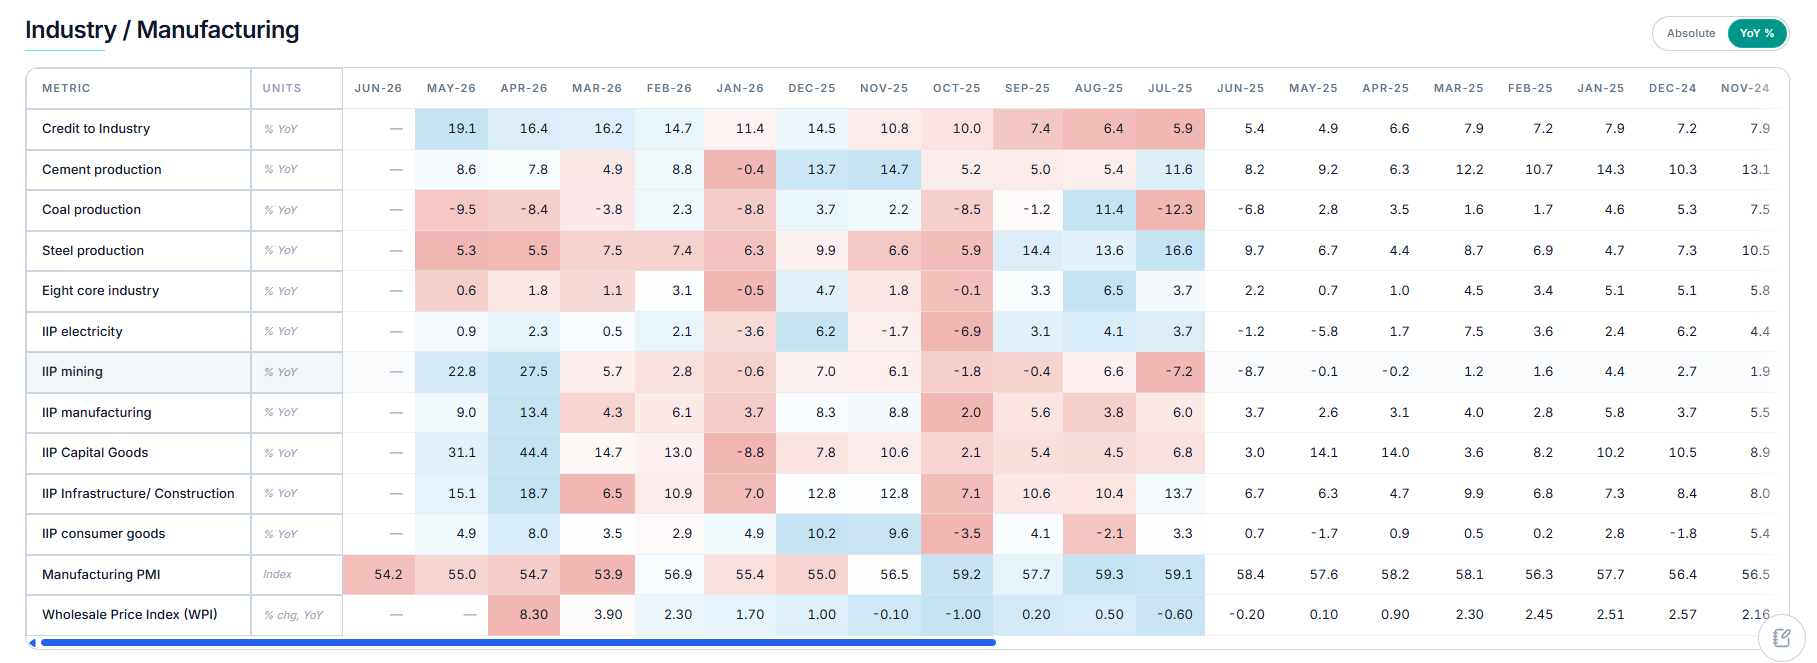
Services — tracks services PMI, airport passenger traffic, railway freight, and e-toll collections. In an economy where services make up a large share of overall activity, this fills in a picture that factory output and retail spending alone would miss — a slowdown here can show up well before it's visible anywhere else.
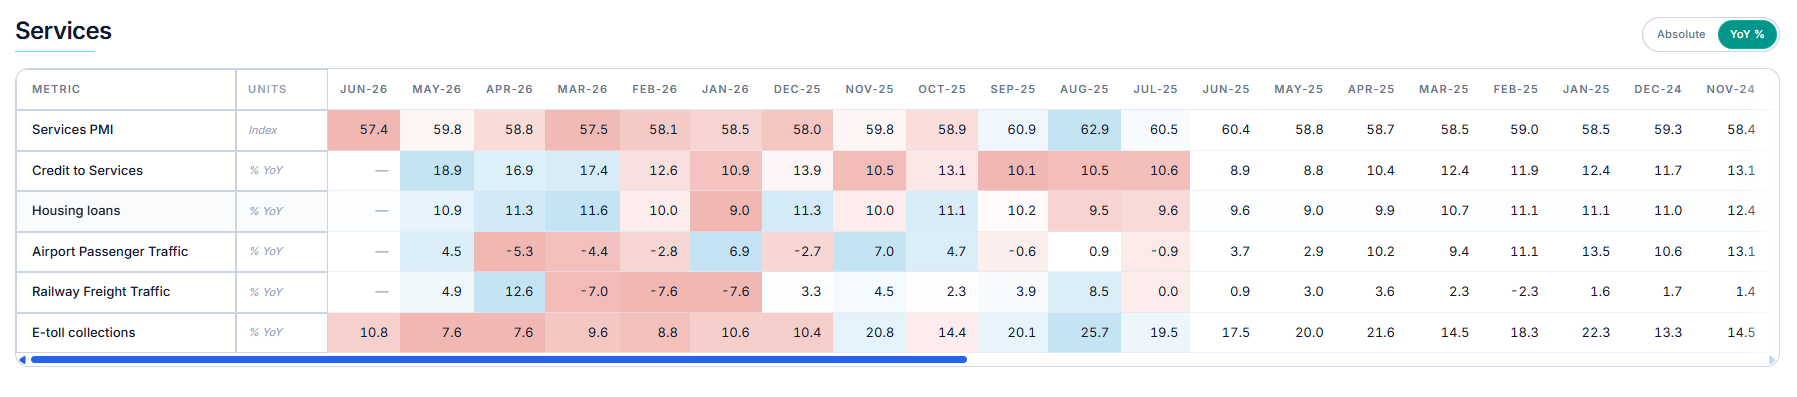
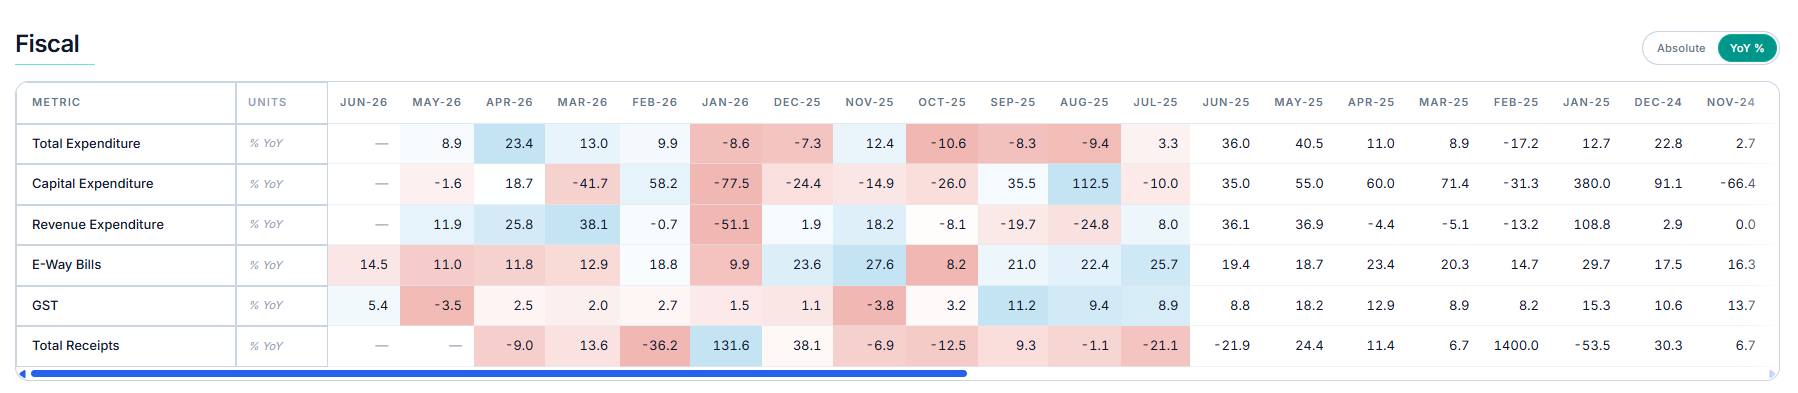
Fiscal — tracks government expenditure, capital spending, GST, and E-Way Bills. Fiscal numbers swing a fair amount depending on where the government sits in its financial year, which is why watching the trend here matters more than any single month.
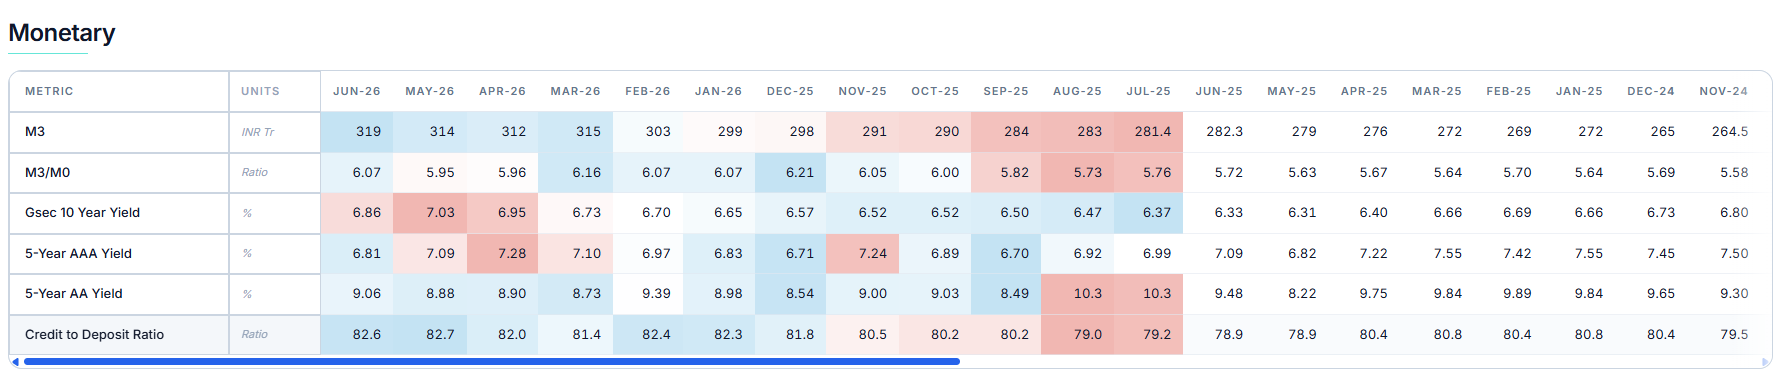
Monetary — tracks money supply, bond yields, and the credit-to-deposit ratio. This is where you can see how liquidity and borrowing costs are shifting — changes here tend to ripple outward into corporate investment and household borrowing alike.
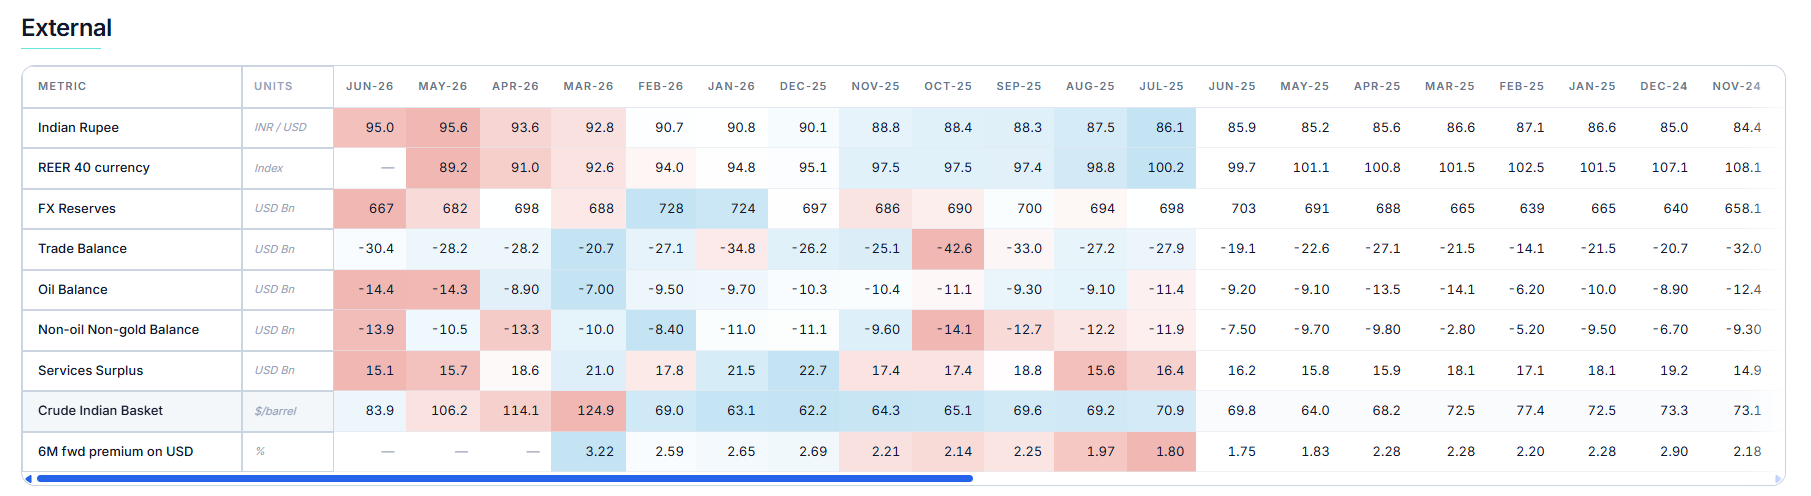
External — tracks the Rupee, FX reserves, trade balance, and crude oil prices. This is India's position against the rest of the world, and how exposed the economy currently is to global price swings.
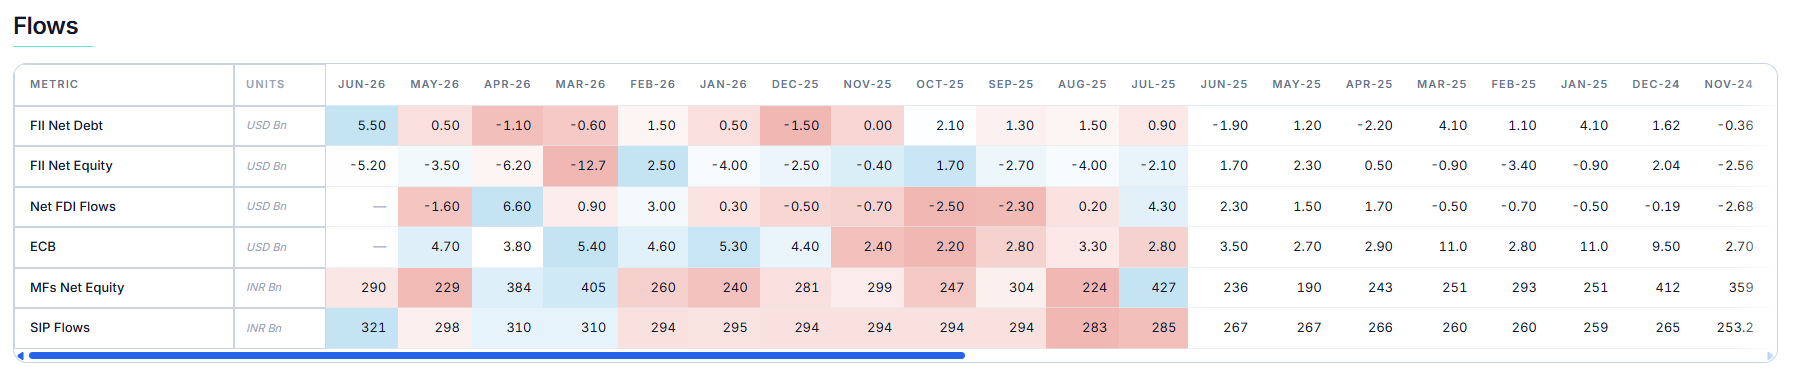
Flows — tracks FII and DII activity, FDI, and SIP flows. This shows exactly how much capital is entering or leaving Indian markets, and through which channel — genuinely different sources of money that don't always move together.
Common Questions
Why does data on this page sometimes look out of date for one indicator but current for another?
Each indicator is published by its own original source, on its own schedule — so different rows on this page can be showing different months at the same time. The page always shows the most recent print available for each one individually.
Should I look at Absolute or YoY % values?
Depends what you're after. Absolute values show the raw figure for that month. YoY % strips out seasonal effects and shows growth compared to the same month a year earlier — usually the more useful number for spotting a genuine trend.
Does a strong month of FDI inflows mean the market will go up?
No. This page describes where capital and activity have actually moved — it is not a signal or a forecast for what markets will do next.