Read Your Weekly Market Recap
Six cards summarizing what happened in the market over your selected date range.
Was this helpful?
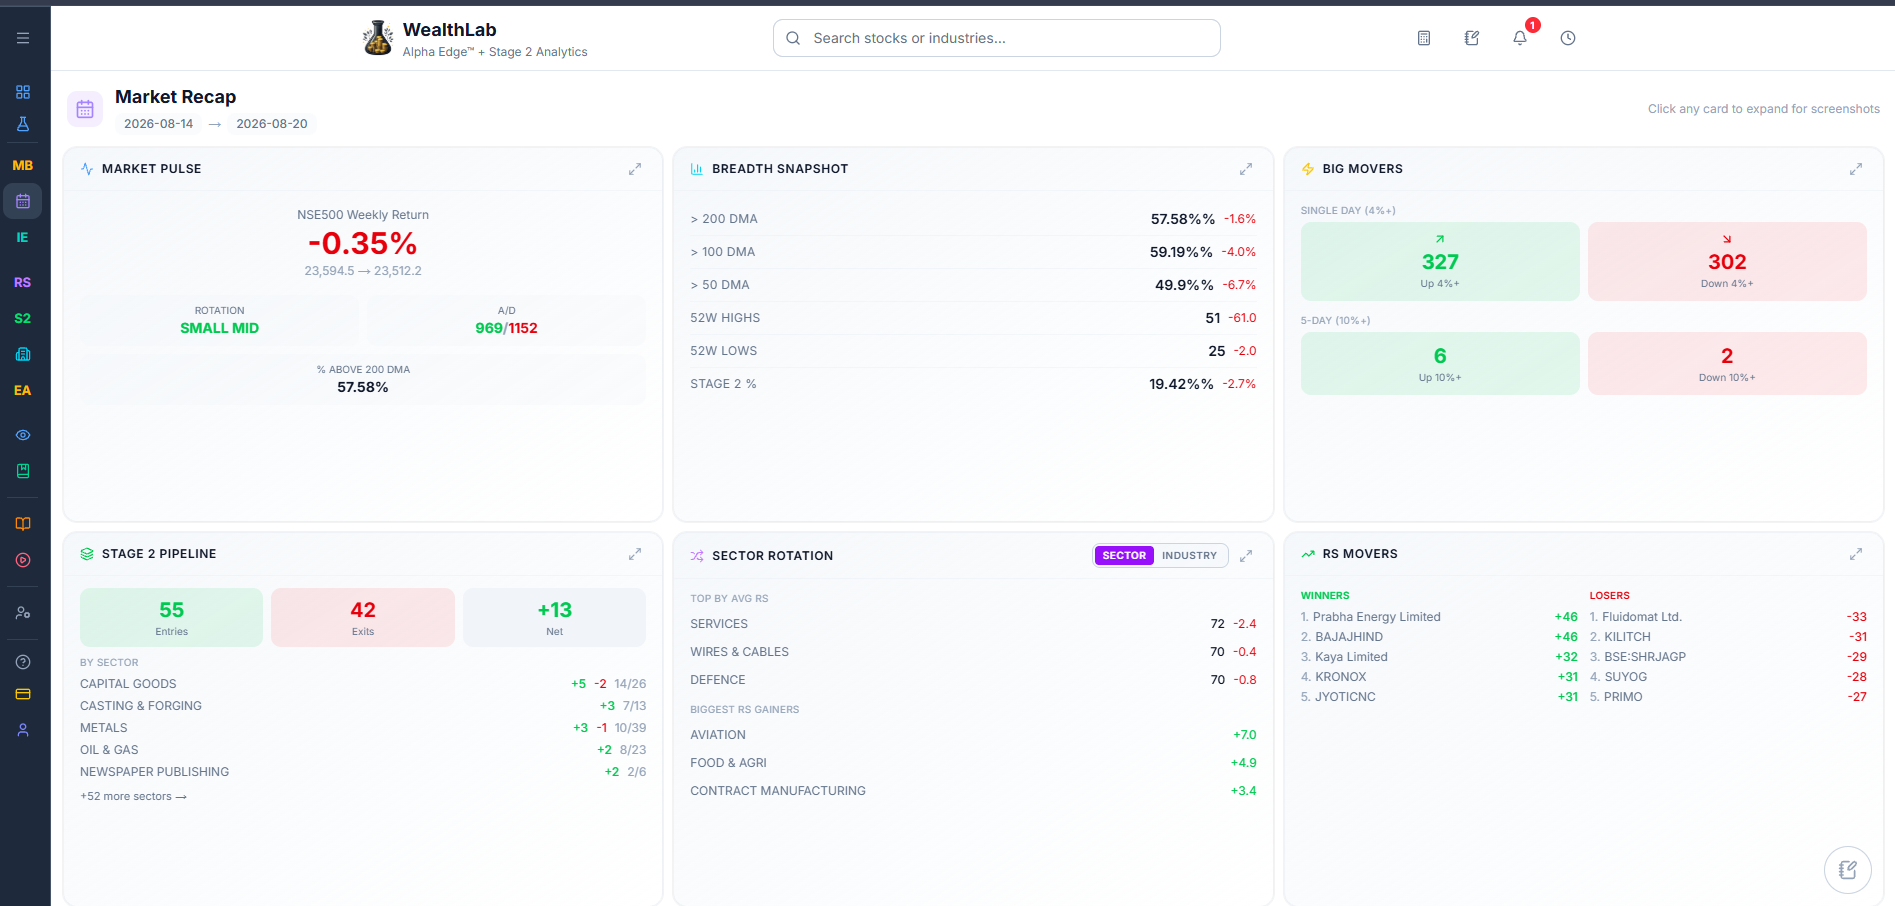
Market Recap summarizes what happened in the markets across six data points: Market Pulse, Breadth Snapshot, Big Movers, Stage 2 Pipeline, Sector Rotation, and RS Movers.
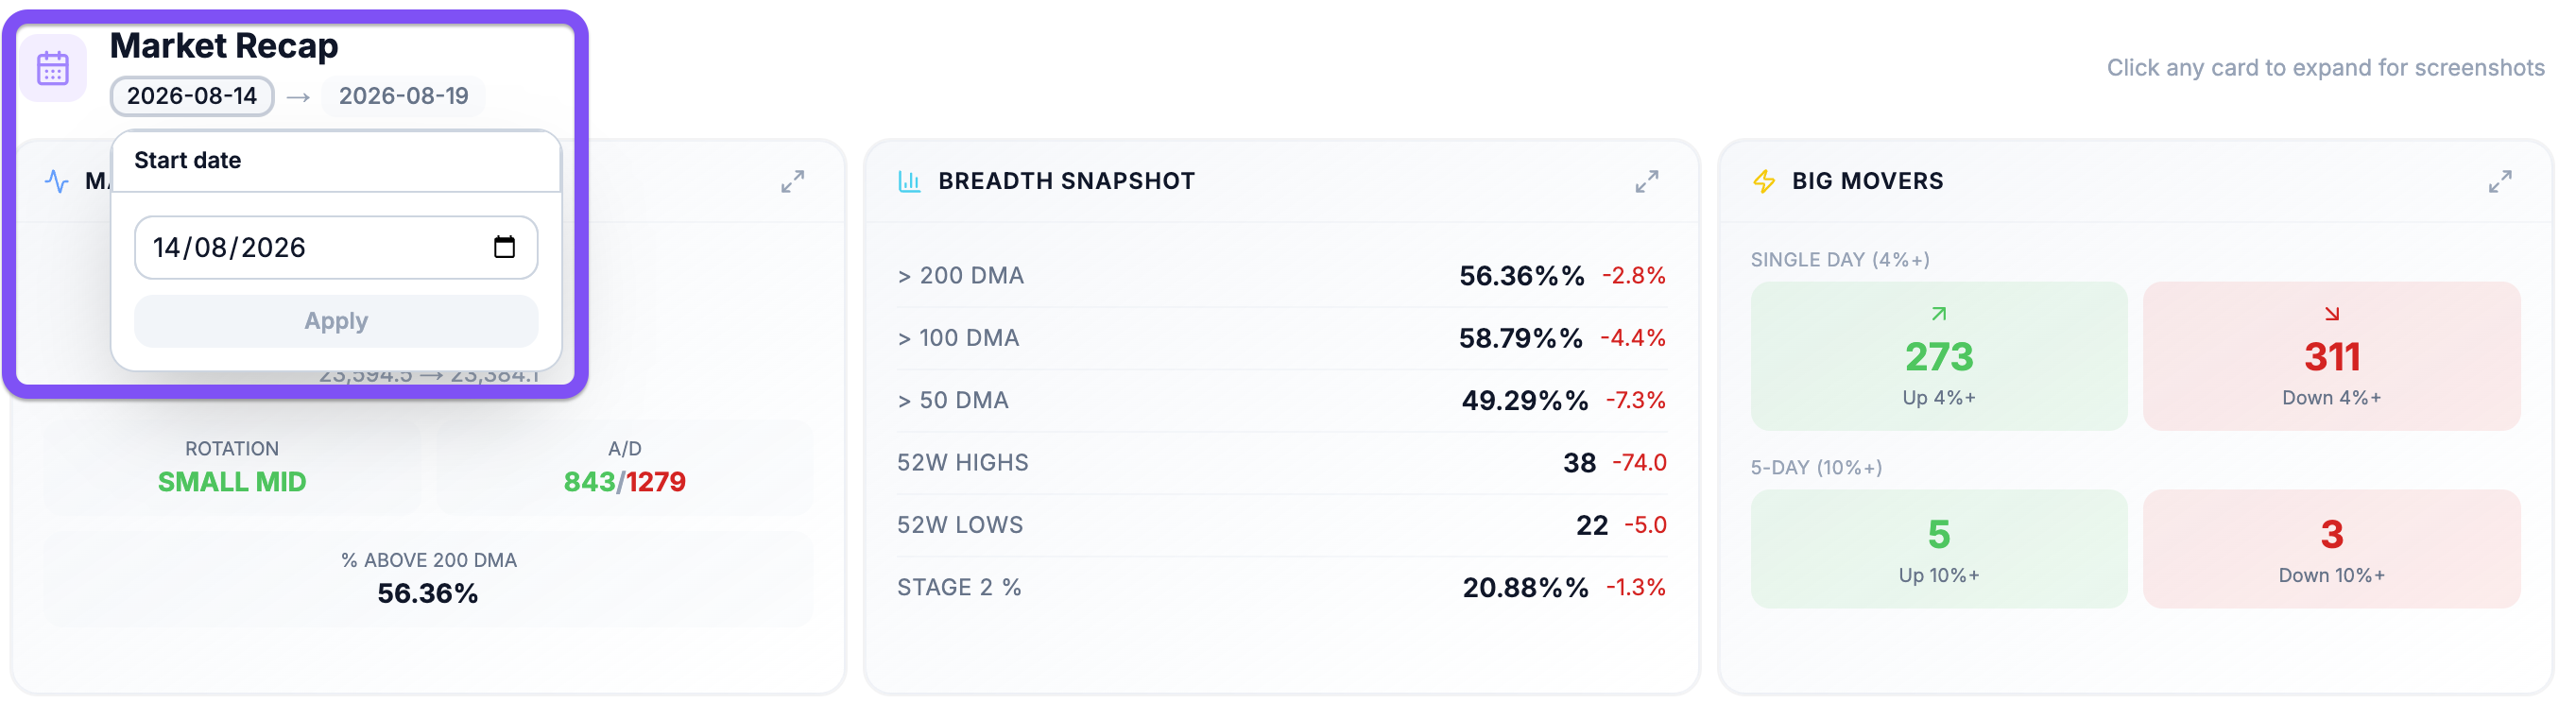
The data takes into account your selected date range to give you a summary. By default, it is set to the last 1 week, but you can change it at any point.
What Each Card Shows
- Market Pulse — the selected period's NSE500 return, the current market cap rotation, the marketwide advance/decline count, and the percentage of stocks above their 200-day average.
- Breadth Snapshot — the percentage of stocks above their 200, 100, and 50-day averages, 52-week high and low counts, and the Stage 2 percentage, each with its change from the previous period.
- Big Movers — how many stocks moved 4%+ in a single day, and how many moved 10%+ over five trading days.
- Stage 2 Pipeline — how many stocks entered and exited Stage 2 during the selected period, and which sector and industry did the momentum (stage 2) come from.
- Sector Rotation — the top sectors or industries by average RS, also their change vs the previous period.
- RS Movers — the selected period's biggest individual stock winners and losers by RS change.
Date Range for Market Recap
The date range defaults to the last 1 week, but you can adjust it using the date range selector at the top of the screen.