What Is Relative Strength?
A 1–100 rating of how a stock's price compares to every other stock.
The RS Rating tells you how a stock's price has performed compared to 2000+ listed stocks on WealthLab. It's the single number that tells you whether a stock is actually leading the market or just moving along with it.
Why Relative Strength Matters
A stock going up doesn't automatically mean much on its own — plenty of stocks rise simply because the broader market is rising.
What the RS Rating captures is whether a stock is doing better than the rest of the market, not just moving with it. A RS rating of 90 would mean that the stock is doing better than 90% of the listed universe.
How to Read the Number
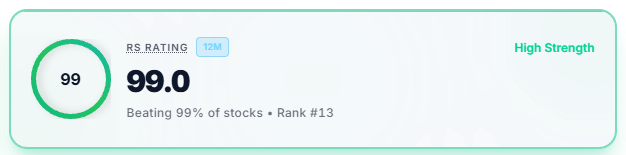
RS is shown as a rating from 1 to 100. A stock with an RS rating of 32 is performing better than only 32% of the stocks on the platform. A stock with a rating of 96 is outperforming 96% of them. The idea behind RS is to help surface the stocks that are actually leading the market — the ones that rise faster when the market goes up, and fall less when the market pulls back.
12M RS vs 3M RS
WealthLab calculates the RS Rating over two separate windows: 3-month and 12-month. The 3-month rating reflects the price behavior over the last 3 months, hence it reacts faster to market trends.
The 12-month rating reflects price behaviour over the last 12 months, giving you a longer, steadier read on how a stock has performed over the past year.
Neither one is more "correct" than the other — they're just answering the question over different stretches of time.
3M RS is more useful for very short term traders, who think in days. 12M RS is the one to go, and the most useful for swing and positional traders.
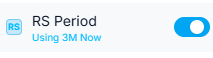
You can switch which timeframe is used across WealthLab — 3M or 12M — from your Preferences.

How Often It Updates
The RS Rating refreshes once every trading day, after the market closes, so the number you see reflects the most recent full day of trading.
Common Questions
Does a high RS Rating mean I should buy the stock?
No. The RS Rating describes how a stock has performed relative to others — it isn't a recommendation to buy, sell, or hold.
Why would a stock's RS change even if its own price barely moved?
Because RS is relative — if other stocks moved more than this one did, its strength against them shifts even without much movement of its own.
Which timeframe should I look at, 3-month or 12-month?
That depends on what you're trying to understand — a stock's very recent behavior, or its performance over a longer stretch. WealthLab shows both so you can compare them and use the one better suited to your needs. If you're a short-term trader who holds for days, 3M RS is better; if you hold for weeks, 12M RS is the right gauge to look at.
How is 3-Month (3M) RS calculated?
Since 3 months is roughly 60 trading days, 3M RS is calculated using a weighted blend: 40% weight to 15-trading-day returns, 30% to 30-trading-day returns, 20% to 45-trading-day returns, and 10% to 60-trading-day returns. This is a scaled-down, proportionate version of how 12M RS is calculated.
When should I use 3M RS vs. 12M RS?
12M RS uses returns over the last 365 calendar days; 3M RS uses only the last 90 days. 3M RS is better suited for short investment horizons (1–2 weeks), for taking exits, or for comparing newly listed/IPO stocks. 12M RS is the right barometer if you intend to hold for longer — it's more stable and less noisy. By default, the platform shows 12M RS; you can toggle to 3M from Preferences, and the setting is saved across sessions until turned off.
RS values seem to differ between screens/pages — why?
"Rank" is generally the RS-based rank everywhere except the Stage 2 page. For stocks, rank is based on RS; for an industry, rank is the average RS of all stocks within that industry. If you see different RS numbers for the same stock, double-check whether you're comparing 3M vs 12M RS — the two are calculated differently and can diverge meaningfully, especially for stocks with a sharp recent move.
A stock's RS is high but the stock has been falling — how do I interpret this?
RS is a gauge of relative strength (performance vs. the market), not the only signal to act on. A stock can have a high 12M RS built on old strength while its recent (3M) momentum is fading. Falling RS simply means the stock isn't outperforming as much right now — it could be due to a pullback, sector rotation, or genuine loss of strength. Use your own investing framework (e.g., moving-average-based exit rules) rather than RS alone to decide entries/exits.