What Is the RS Screen?
A ranked view of the market's current leaders by relative strength.
If you are someone who loves Relative Strength and being with the leaders of the market, the RS Screen is your home.
If you would like to know more about what Relative Strength is, watch this video:
By default, the RS Screen shows the top 20% of the market, that is RS 81–100. This is done so that you can get the overall view of strength in a single look at the platform.
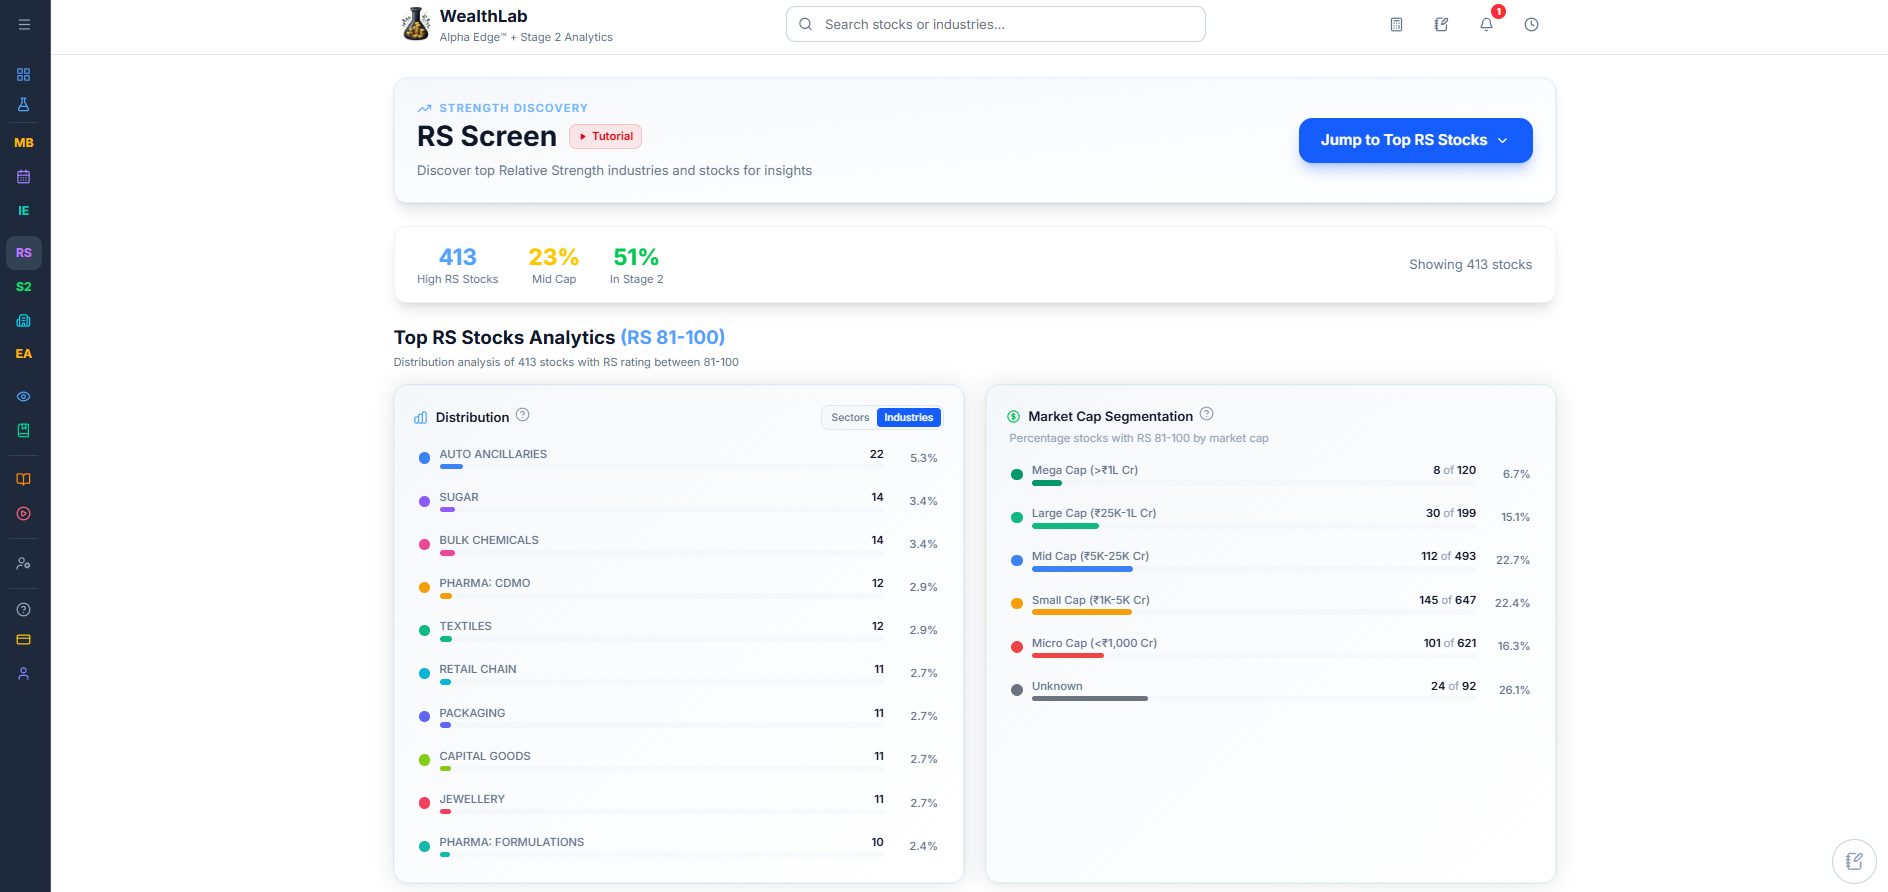
A Quick Tour of the Page
At the top, summary stats give you the shape of whatever's currently on screen — how many High RS Stocks there are, which Market Cap they belong to, and what percentage are already in Stage 2.

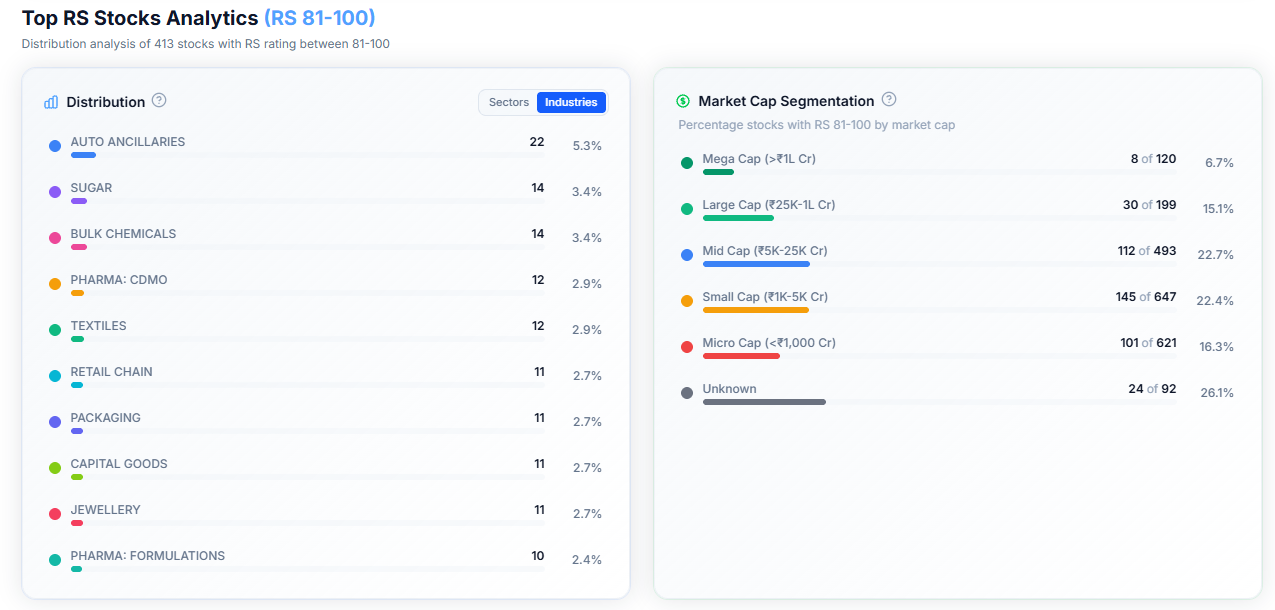
Just below that, the Distribution and Market Cap panels break the top 20% stocks down by sector, industry, and company size — for you to know where it the top 20% strength coming from. See RS Industry Distribution and Market Cap Distribution for how to read them.
The filter row and sliders let you narrow things down further by sector, industry, market cap, RS range, or how long a stock has been in Stage 2 — covered in Filtering Stocks on the RS Screener
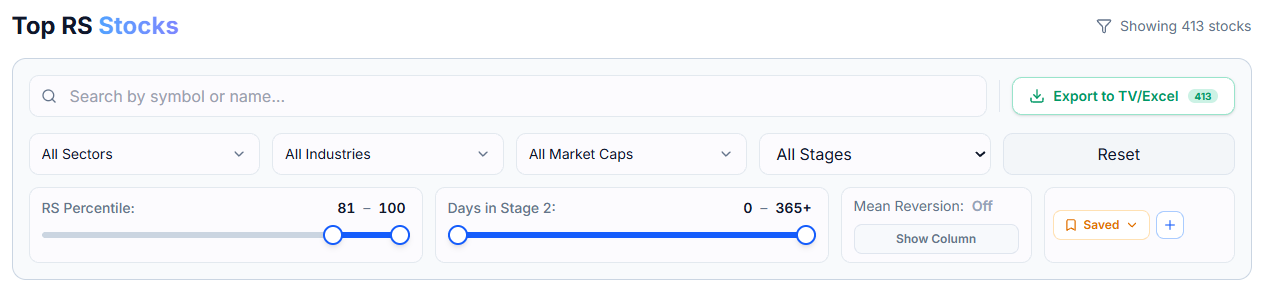
Once your filters are set the way you like, you can save them or export the results — see Saving and Exporting a Screen
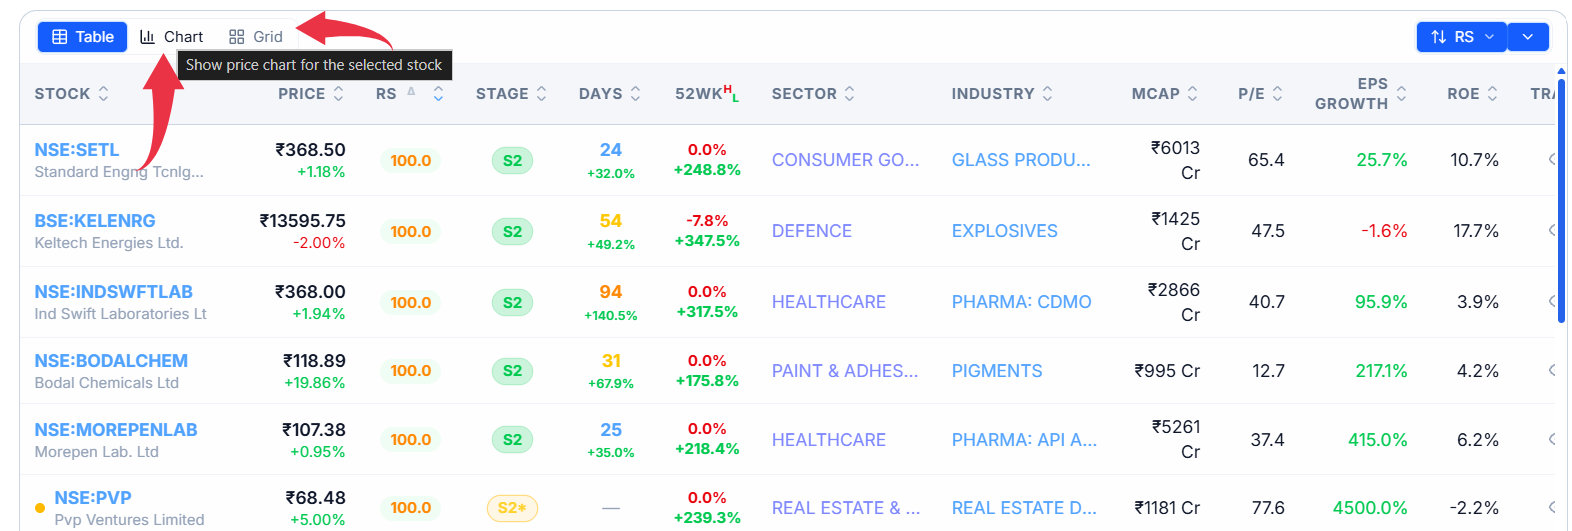
The stock table itself is where it all comes together. Switch to Chart view to flip through each stock's chart individually, or Grid view to see several at once — both use the same daily or weekly candle view you'll find on any stock's own page.
Common Questions
Why does the RS Screen open on RS 81–100 instead of the whole market?
That range is the top 20% of stocks by relative strength, so the default view starts you off looking at the market's current leaders rather than everything at once.
Can I see the whole market instead of just the top 20%?
Yes — just widen the RS Percentile slider down to 1, and the table will include every stock instead of only the top range.