RS Industry Distribution and Market Cap Distribution
See which sectors, industries, and company sizes lead the top-RS list.
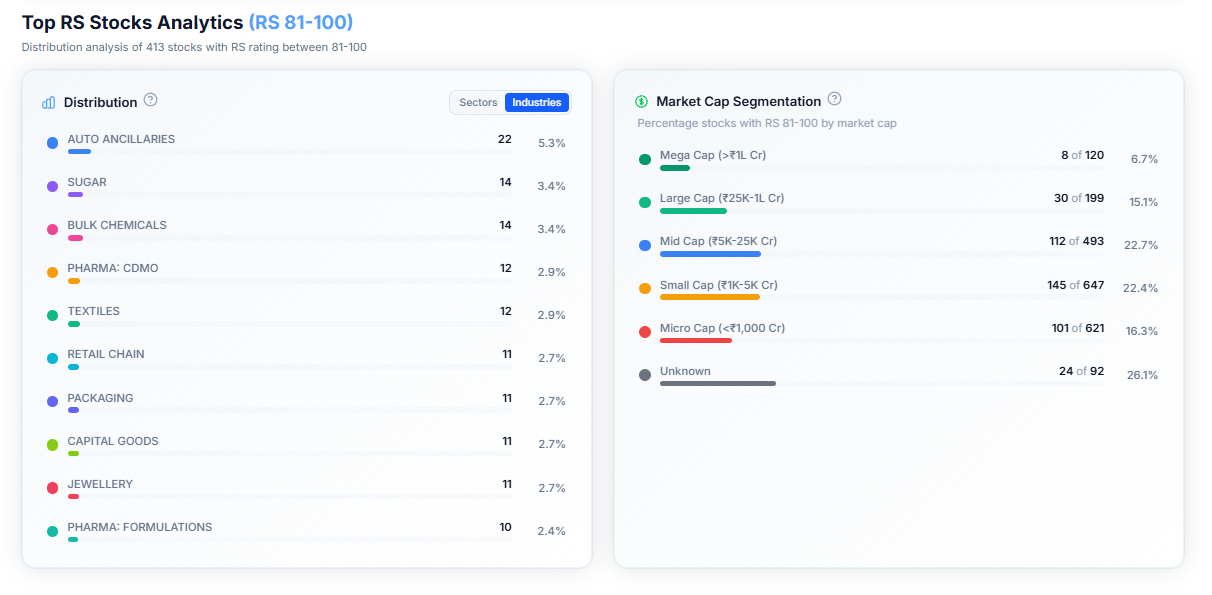
WealthLab primes on helping you find the best Sector → Industry → Stock. When you have the list of the top 20% of stocks in the market, the next obvious questions are:
- Which industries and sectors are these stocks coming from, to find the leading industries?
- Which market cap is currently being favoured — large caps, small caps?
Distribution: Sectors and Industries
The Distribution panel shows which sectors the stocks currently on screen are coming from, and you can toggle it to show industries instead.
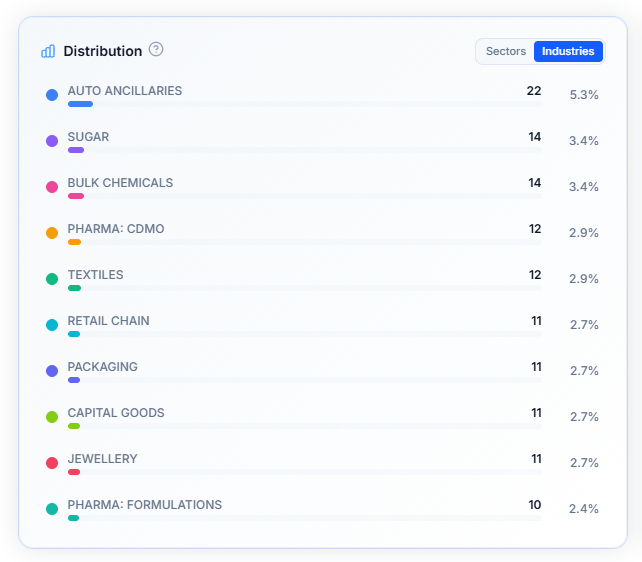
In the above example, 5.3% of the leaders are coming from Auto Ancillaries, 3.4% are coming from Sugar, another 3.4% from Bulk Chemicals and so on. This way you have an insight on which industries are the market leaders coming from.
It's worth knowing the difference between the Sectors and Industries: sectors are broad groupings — BFSI, Auto, Healthcare — while industries are the narrower categories inside them. Auto, for example, contains industries like auto components, auto manufacturers, and auto parts. BFSI contains private banks, public banks, and NBFCs, among others.
Looking at both levels tells you not just which sector is leading, but which specific industry within it.
Market Cap Segmentation
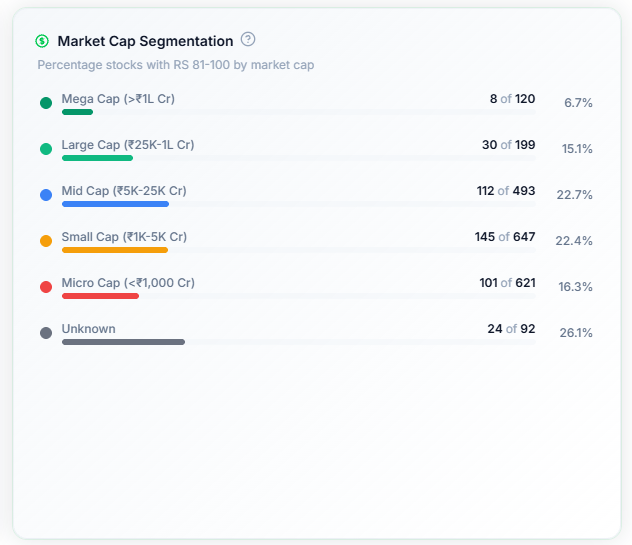
This panel groups the top 20% of the stocks by size — Mega, Large, Mid, Small, and Micro Cap — showing a count and percentage for each. This tells you which market cap currently make up more of the top-ranked stocks, and which are underrepresented.
Why This Is Useful
On their own, a list of a few hundred top-RS stocks can be a lot to work through. Seeing which sectors, industries, and market caps they're concentrated in gives you a starting point for narrowing that list down to something more focused, before you move on to filtering or reviewing individual stocks.
Common Questions
Do these panels update as I change filters?
Yes — as you change the filters on the page, the stats start to show the distribution for the stocks that fit in your filtered list.
What's the difference between the "Top RS Industries" table and the "RS 81–100 distribution" table?
The 81–100 bucket reflects the distribution within just the top 20% of all stocks (roughly 369 stocks), while "Top RS Industries" considers the full list of stocks on WealthLab (2,000+ stocks).
How can I check market-cap rotation (large vs. mid vs. small)?
Two ways: check the Breadth: Rotation chart — the ratio of Nifty Midsmall 400 to Nifty 100 shows whether the market favors SMIDs vs. large caps — or use the Market Cap Segmentation panel above, which is also available on the Stage 2 screen and shows which market cap currently has strength or momentum.