Industry Distribution and Market Cap Distribution
Where the current stage's stocks are coming from, by sector and size.
Once you know how many stocks are in Stage 2, the natural next question is: where are they coming from? These two panels answer that.
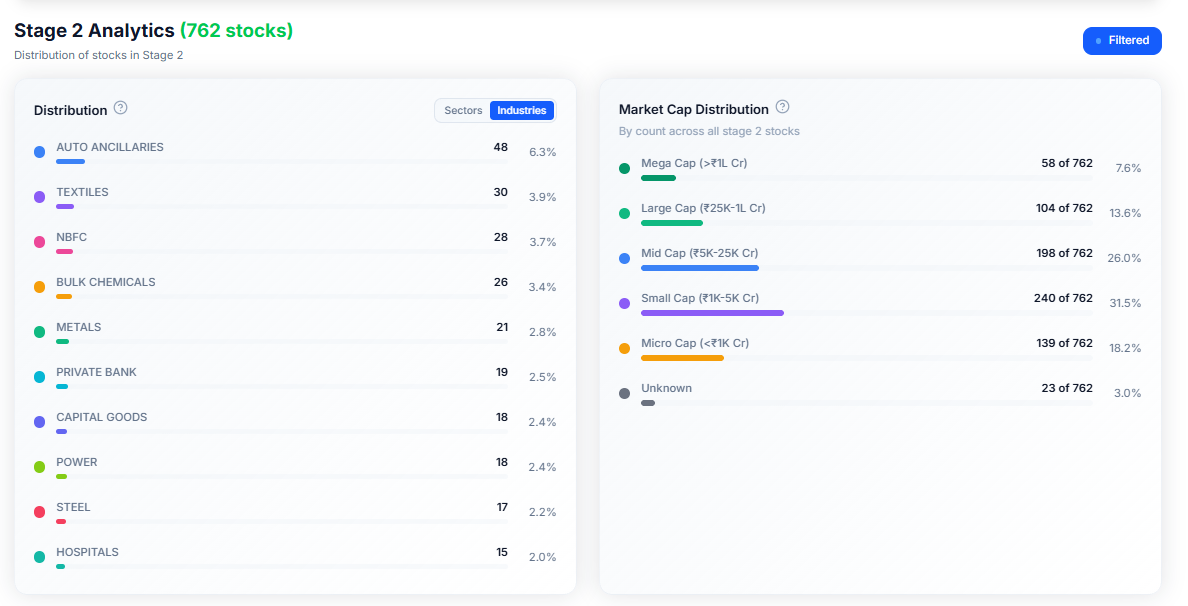
Distribution: Sectors and Industries
This data shows which sectors and industries the select stage's stocks are coming from — toggle between sector or industries to know which are the momentum leading sectors and industries.
Sectors are the broader groupings; industries are the narrower categories within them. Healthcare, for example, contains industries like hospitals, pharmacies, and CDMOs. Seeing both levels shows you not just which sector has the most stocks in this stage, but which specific corner of it.
Market Cap Distribution
This panel groups the selected stage stocks by company size instead — Mega, Large, Mid, Small, and Micro Cap — with a count and percentage for each. This helps you find which market cap is being favoured from momentum.
This Reflects Your Current View
Both panels always reflect whichever stage you've selected and whether you've chosen to include Stage 2 Candidates — switch either setting, and the panels recalculate to match.
Common Questions
Why do these percentages change over time?
Because the underlying set of stocks in each stage changes as stocks move between stages — the panels always reflect the current picture, not a fixed snapshot.
Why does "Unknown" sometimes appear in Market Cap Distribution?
That means WealthLab doesn't yet have market cap data for that particular stock.
Related Articles
What Is Stage 2 Analysis? · What Is a Stage 2 Candidate? · Finding and Filtering Stage 2 Stocks