Chart Setups Distribution and Market Cap Distribution
See which sectors, industries, and company sizes today's setups are coming from.
Once you know how many setups are on screen, the natural next question is: where are they coming from? These two panels answer that.
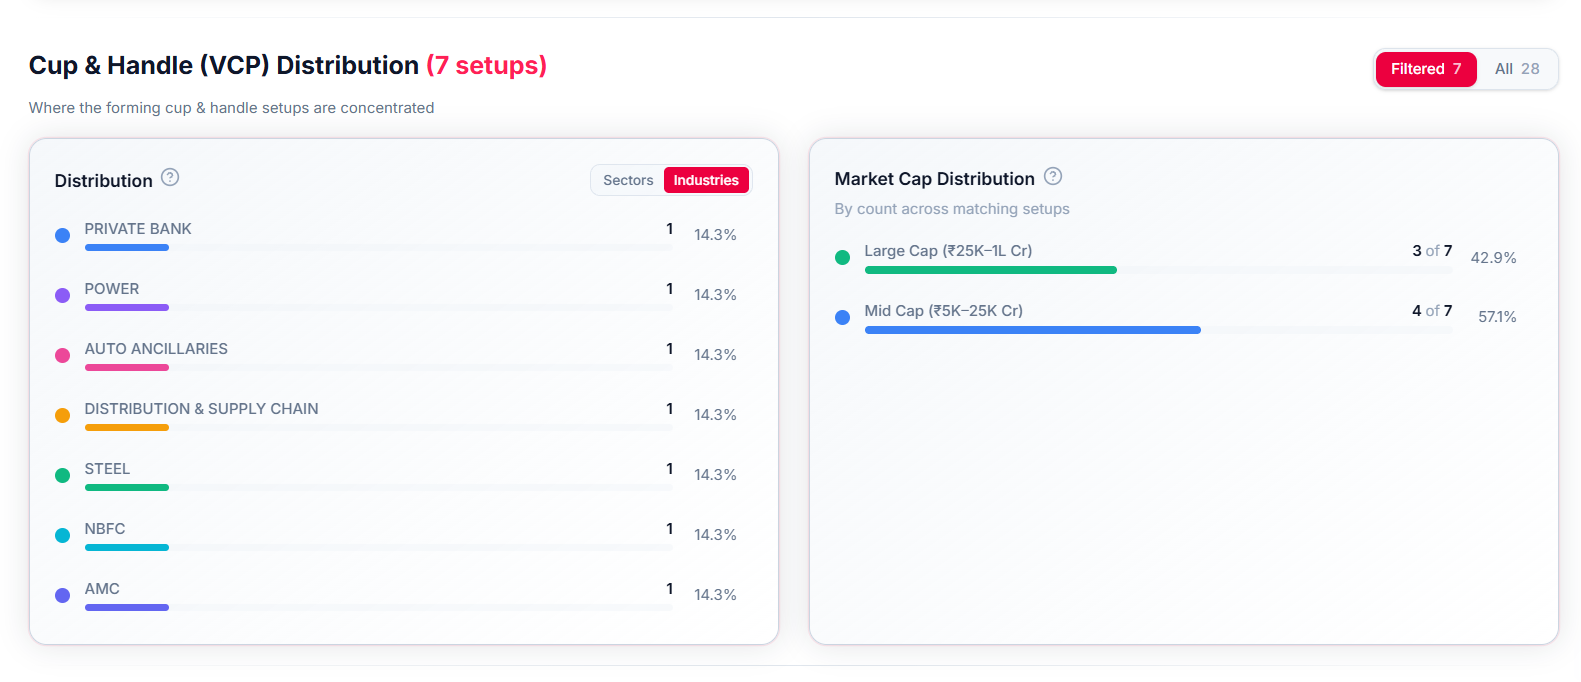
Distribution: Sectors and Industries
This shows which sectors and industries the current setups are coming from — toggle between Sectors and Industries to see which corners of the market are producing the most pause-and-continue patterns right now.
Market Cap Distribution
This panel groups the same setups by company size instead — Mega, Large, Mid, and Small Cap — with a count and percentage for each, so you can see whether today's setups are concentrated in larger, more established names or smaller, more speculative ones.
This Reflects Your Current View
Both panels always reflect whichever pattern type and filters you currently have selected — switch the pattern, the stage tab, or any filter, and the panels recalculate to match.
Where You Will See This
This appears on the Chart Setups screen.
Common Questions
Why do these numbers change when I switch pattern types? Because each pattern type has its own set of matching stocks — switching from Cup & Handle to High Tight Flag changes the underlying list, so the distribution changes with it.
Why does the panel say "Filtered" next to a smaller number, and "All" next to a bigger one? "Filtered" reflects only the setups currently matching your filters; "All" reflects every setup found for that pattern type, before your filters are applied.