Viewing Setups: Table, Chart, and Grid Views
Flip through setup charts one at a time, or compare several side by side.
Once you've filtered down to the setups you care about, you'll want to actually look at the charts — this is where that happens.
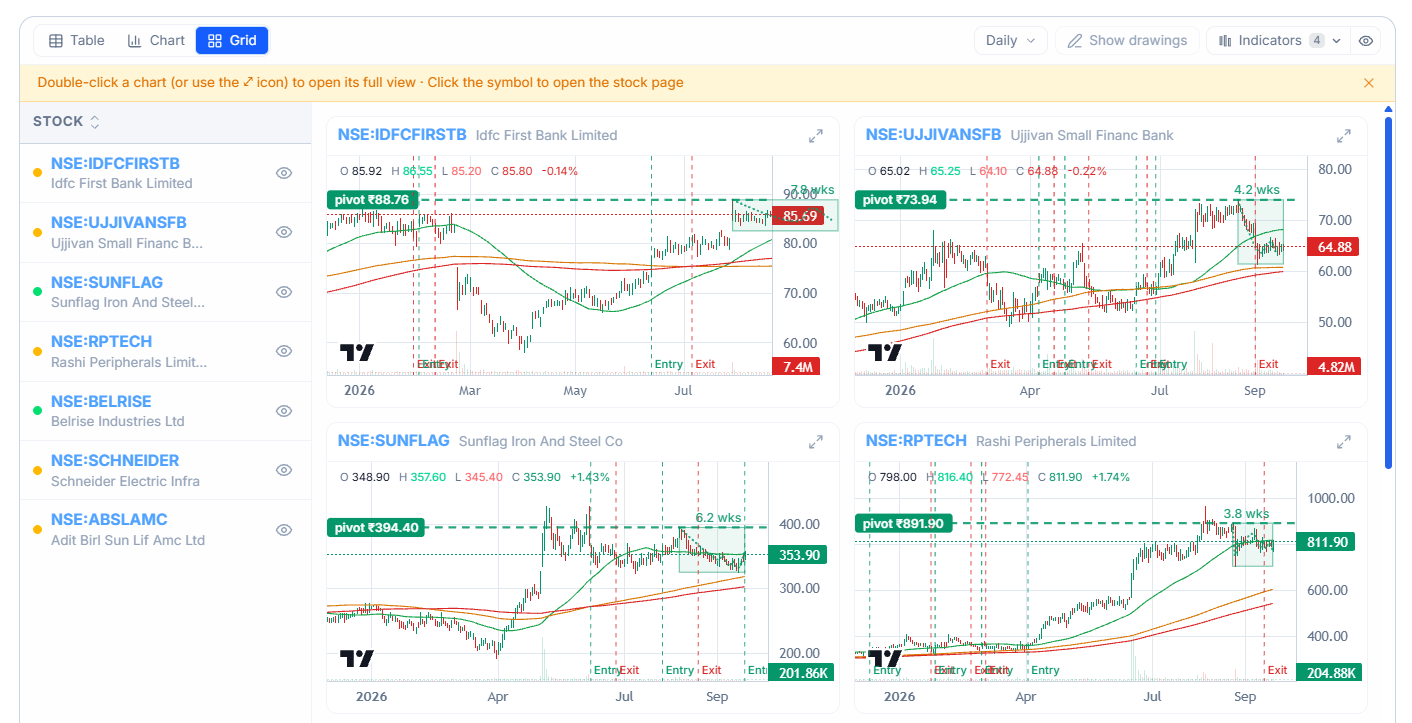
Table, Chart, and Grid
- Table — a plain data view of every matching stock, useful for scanning numbers quickly.
- Chart — flip through each stock's chart one at a time.
- Grid — see several stocks' charts at once, laid out side by side, so you can compare setups without opening them one by one.
Reading a Setup's Chart
Each chart shows a dashed line marking the setup's breakout level, along with how many weeks the stock has been pausing. Where relevant, an Entry marker shows where the stock crossed above that level. Double-click any chart (or use the expand icon) to open it in full view, or select the stock's symbol to go straight to its own page.
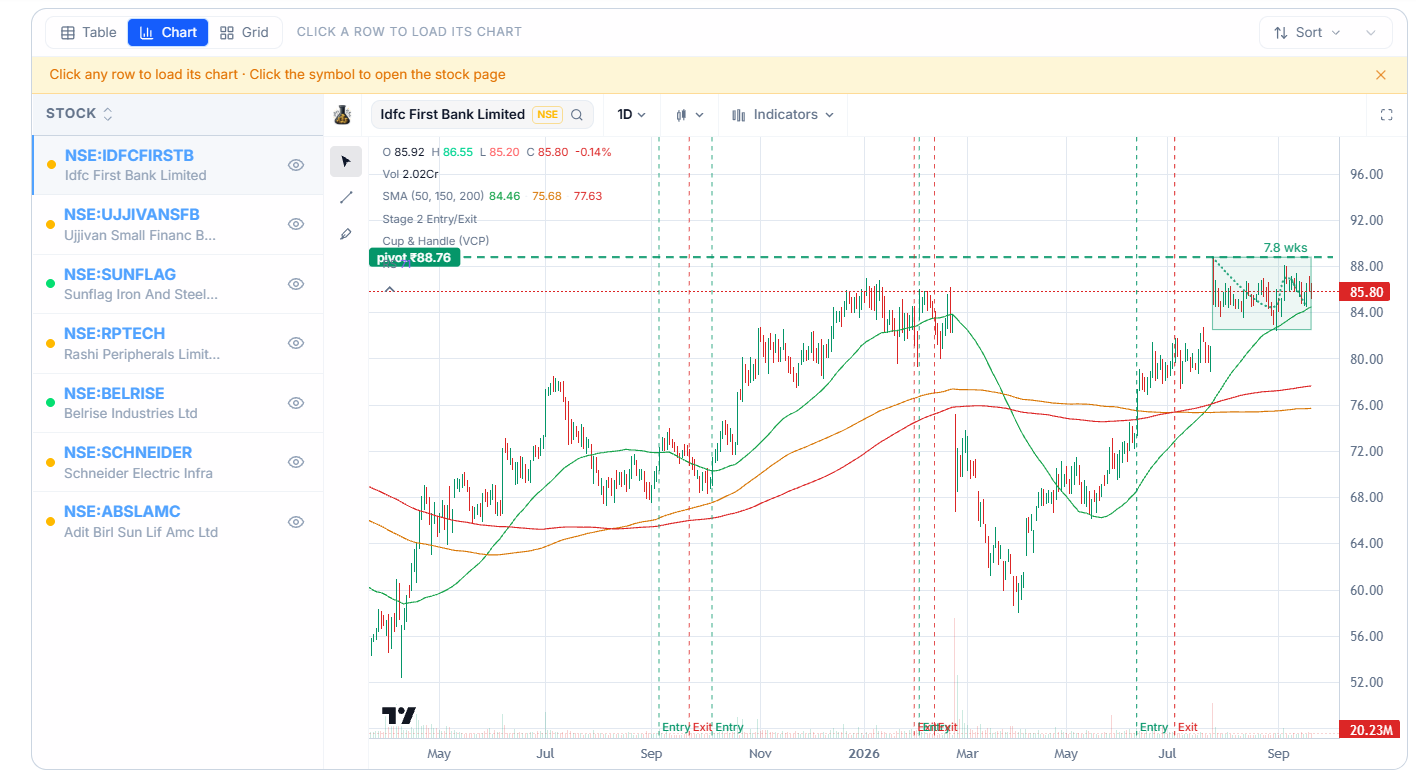
Daily and Weekly Views
Switch between Daily and Weekly candles depending on whether you want a close-up or a wider view of the setup. You can also toggle on drawings and indicators for extra context on the same chart.
Exporting
Once you've got the list you want, use Export to TV/Excel to download the matching setups for use elsewhere.
Common Questions
What does the dashed line on each chart mean? It marks the breakout level for that setup — the price the stock needs to clear (and hold above) for the pattern to be considered underway.
Can I add a stock straight to my Tracking list from here? Yes — select the eye icon next to a stock to add it to Tracking without leaving the screen.
Related Articles
What Is the Chart Setups Screen? · Understanding Pattern Types · Filtering and Finding Setups