What Is a Stock Detail Page?
The whole platform condensed down to one company, in one scroll.
We have made analysing a single stock an extremely simple and easy task for you, here at WealthLab.
Every stock on WealthLab has its own page, and that page is really the whole platform condensed down to one company — its price, its stage, its relative strength, its fundamentals, and how it stacks up against everything else in its industry, all in one place. Instead of piecing a picture together across five different screens, you get it in one scroll.
The Header
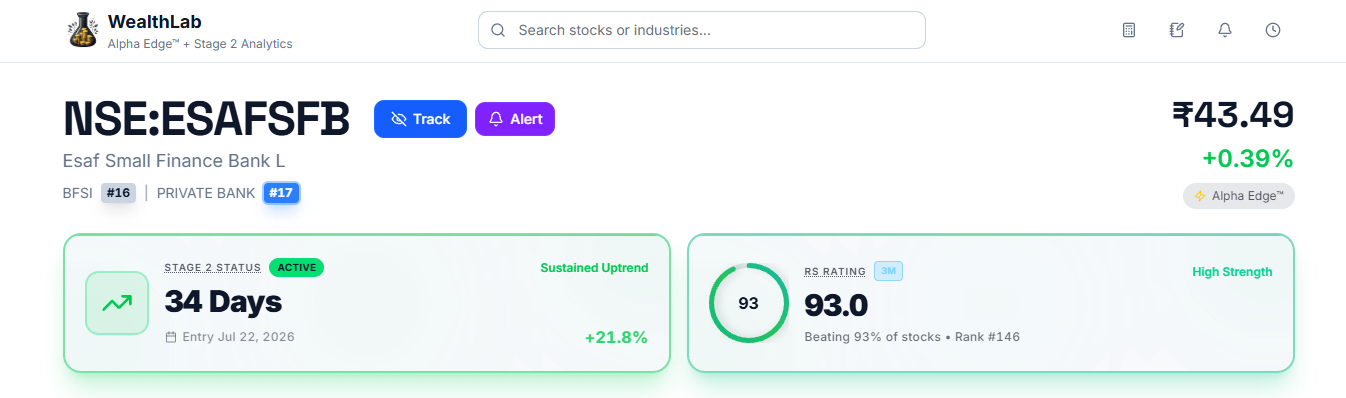
At the top sits the stock's ticker, company name, current price, and the day's change.
Next to that are two buttons — Track, which adds the stock to your Tracking list, and Alert, which lets you set a price, stage, or Relative Strength.
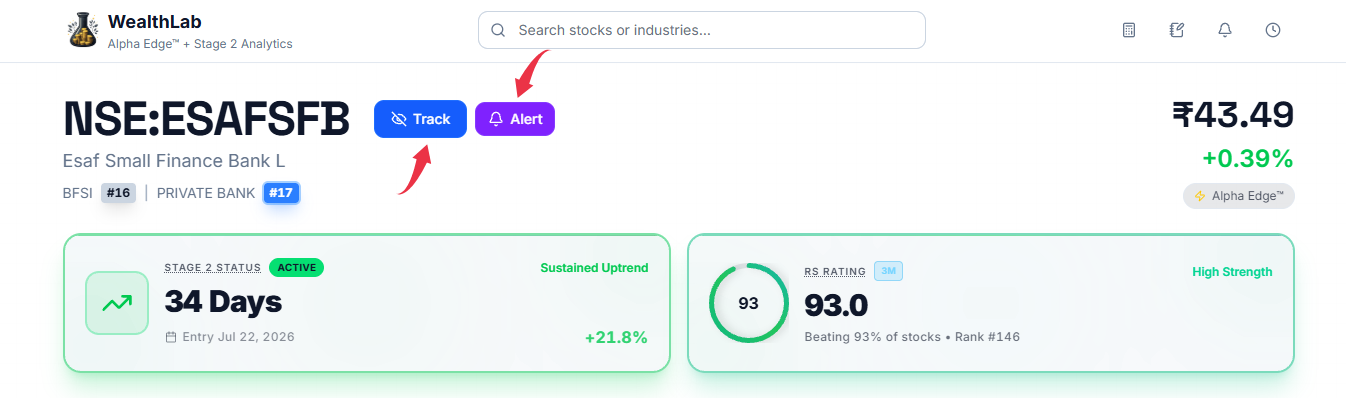
Below the price, you'll see the stock's sector and industry, each tagged with its current rank — for example, a stock might be ranked within the top 20 of its sector and within the top 20 of its industry, so you know at a glance where it stands in both.
The Stage Status Card
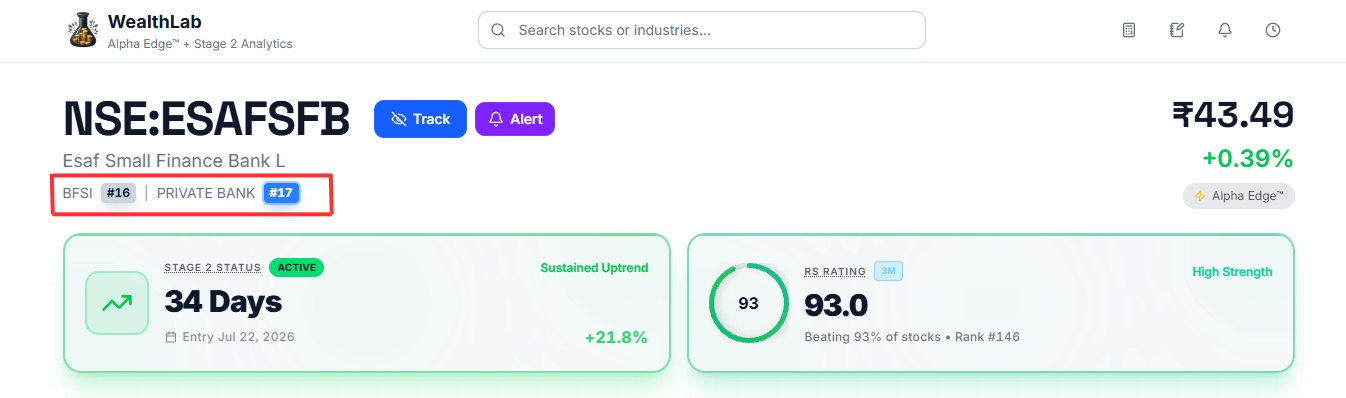
This card tells you which stage the stock is currently in — S1 through S4 — along with a plain-language label like Advancing or Declining. It also shows the last date the stock was in Stage 2, which is useful context even when a stock has since moved into a different stage.
The RS Rating Card
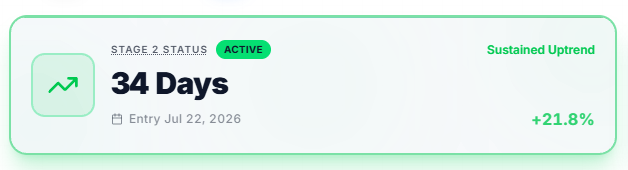
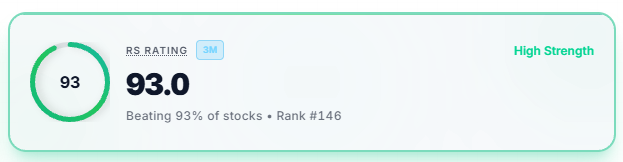
This shows the stock's current RS Rating as a circular gauge, along with what share of stocks it's currently beating and its overall rank out of the full universe. A label underneath — something like Poor Strength or Strong — gives you a quick read without needing to interpret the number yourself. The card also shows which timeframe the rating reflects, since WealthLab tracks RS over both 3-month and 12-month windows.
What's Further Down the Page
Below the two status cards sits the price chart itself, and past that: the Fundamentals panel, RS and industry-ratio charts, shareholding data, a comparison against peers and industry, and a look at the stock's own Stage 2 history and recent filings. Each of these gets its own article next.
Common Questions
Does a low RS Rating or a Declining stage mean I should sell the stock?
No. Both describe where the stock currently stands — neither is a recommendation to buy, sell, or hold.
Why does the RS Rating card show "3M"?
That indicates the rating shown is calculated over a 3-month window. WealthLab also tracks a 12-month RS Rating, and you can switch which one is shown from your Preferences.
Related Articles
The Price Chart · Fundamentals Panel · Stock's Relative Strength Chart