Fundamentals Panel
Market cap, key ratios, and the quarterly P&L, all in one place.
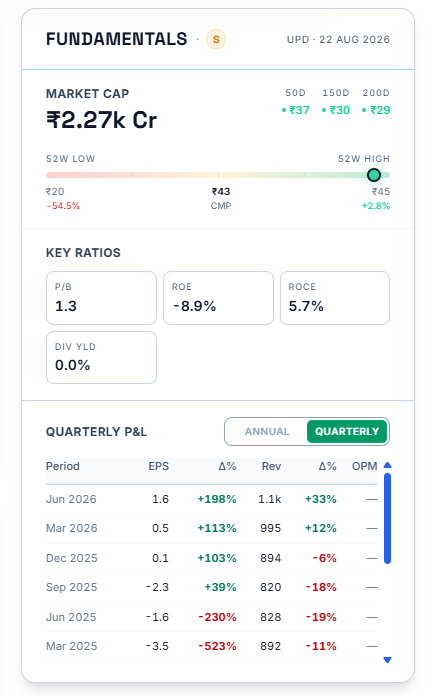
The Fundamentals panel is where a stock's business numbers live — market cap, valuation ratios, and several quarters of reported results, all pulled together in one place so you don't have to go hunting for them separately.
Market Cap and the 52-Week Range
At the top of the panel sits the stock's current Market Cap, followed by a visual range showing where the current price sits between its 52-week low and high. Along that same range, you'll see where the 50-day, 150-day, and 200-day moving averages currently fall — a quick way to see whether the stock is trading above or below its own longer-term trend lines without opening the chart separately.
Key Ratios
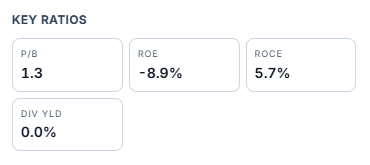
Six ratios sit together in a grid: P/E, PEG, P/B, ROE, ROCE, and Dividend Yield. These are calculated from the company's most recently reported numbers, and having them side by side makes it easy to get a quick read on valuation and profitability together, rather than checking each one individually.
The Quarterly P&L Table
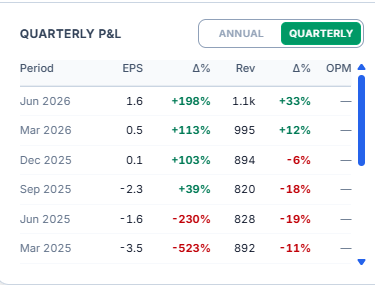
Below the ratios sits a table of the company's reported results, toggle-able between Annual and Quarterly views. Each row is one period, with EPS, Revenue, and OPM, and a year-over-year change shown next to both EPS and revenue so you can see growth at a glance rather than calculating it yourself.
Common Questions
What does the letter grade S or C next to "Fundamentals" mean?
S stands for stand-alone results, while C stands for consolidated results. Stand-alone refers to the parent company's performance only, while consolidated results include the performance of the company's subsidiaries.
Related Articles
What Is a Stock Detail Page? · The Price Chart · Stock's Relative Strength Chart