Filtering, Sorting, and Exporting Results
Layer table filters on top of your query, sort, and export the list.
Your query narrows the universe down to a matching set of stocks. The results table below it is where you take that list and actually work with it.
Narrowing Further
Beyond your query itself, the table has its own set of filters layered on top — Sector, Industry, Market Cap, and All Stages, plus sliders for RS Percentile and Days in Stage 2.
You can also search directly by symbol or company name if you're checking whether a specific stock made the cut.

Sorting and Viewing the Results
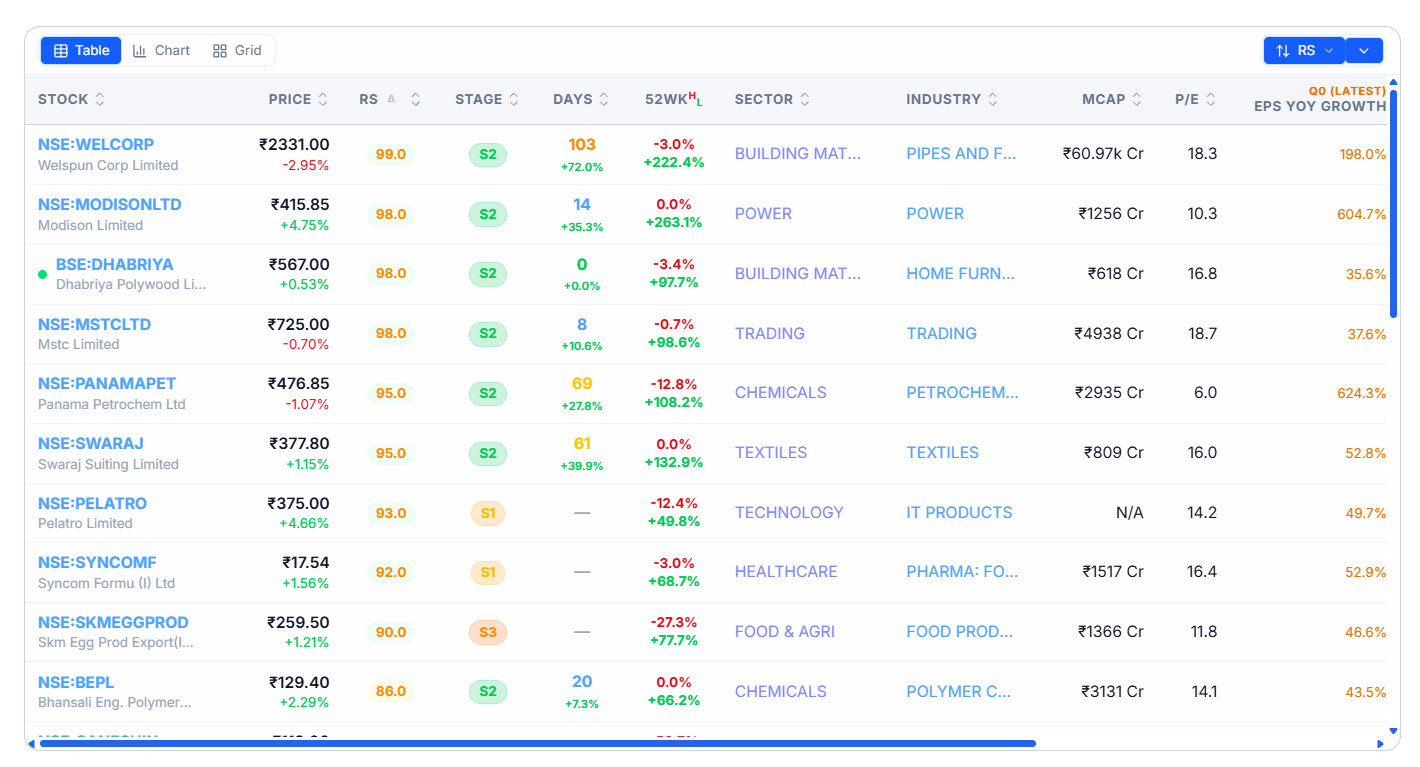
The table itself can be sorted by any column — by default it's sorted by RS, but you can just as easily sort by the earnings field your query was actually built around, which is often the more useful view. Switch between Table, Chart, and Grid depending on whether you want to read the numbers or look at price action directly.
Exporting Your List
Once you're happy with the results, select Export to TV/Excel to pull the whole list out. This exports exactly what's currently showing — your query conditions and any additional filters you've layered on top, together.
Common Questions
Do these table filters change my query, or just what I'm looking at?
They don't touch your query conditions at all — they just narrow the results you're already looking at. Your original query keeps running underneath; these filters are layered on top of it.
Does exporting include the earnings field I filtered on?
Yes — the table always includes a column for whichever field your query is built around, and that carries through to the export.
If I add extra filters after running my query, do I need to run the query again?
No — the table filters apply live on top of your existing query results, without needing to re-run anything.