What Is the Earnings Screen?
Build your own multi-quarter conditions and see which stocks satisfy all of them.
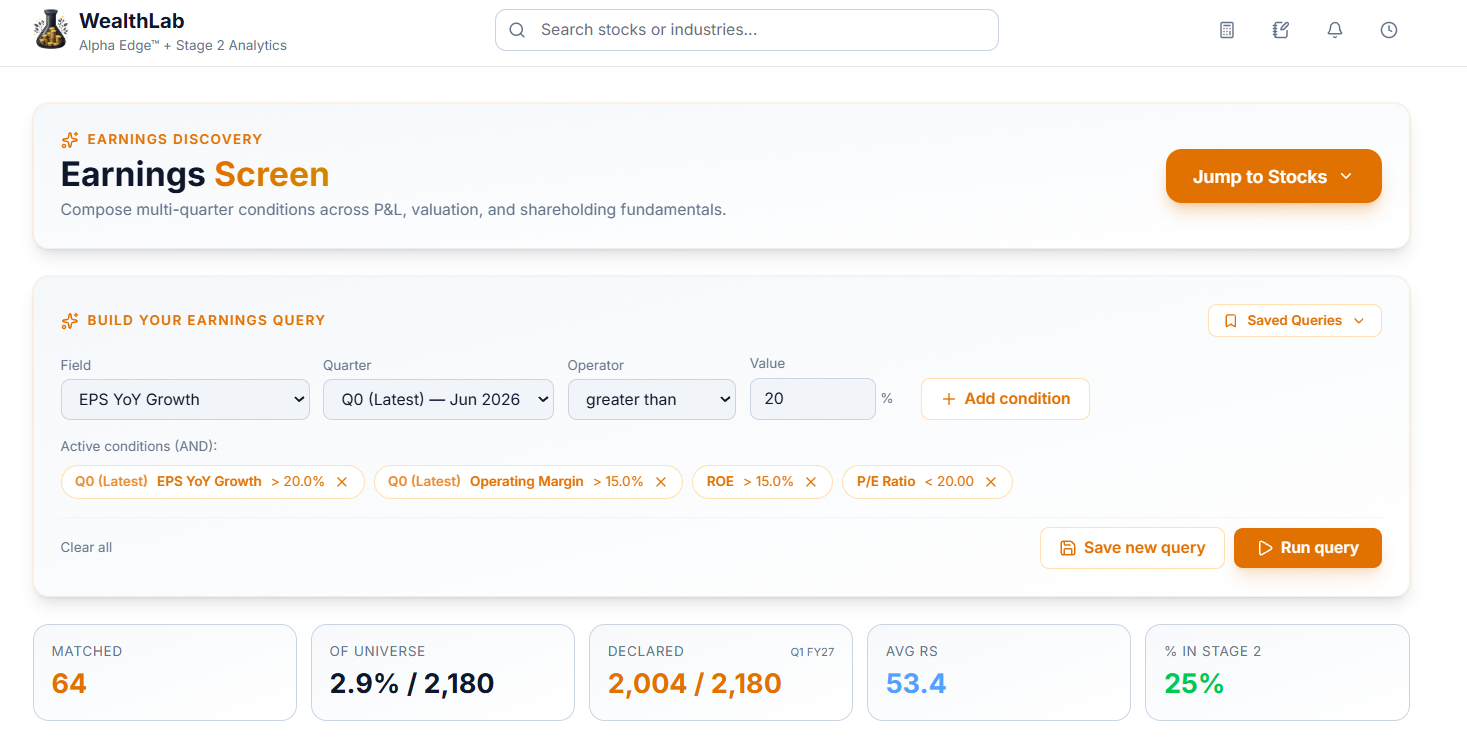
The Earnings Screen lets you build your own conditions across multiple quarters of P&L, valuation, and shareholding data, and then shows you exactly which stocks satisfy every single one.
Why Build Your Own Query Instead of Using a Fixed Filter
Two people looking for "good earnings growth" might mean completely different things — one wants strong EPS growth with healthy margins, another wants a low P/E alongside rising ROE. A fixed filter can't accommodate both.
Earnings screen allows you to build your own queries and conditions, because you're the one deciding which conditions matter and how strict each one should be.
What's on This Screen
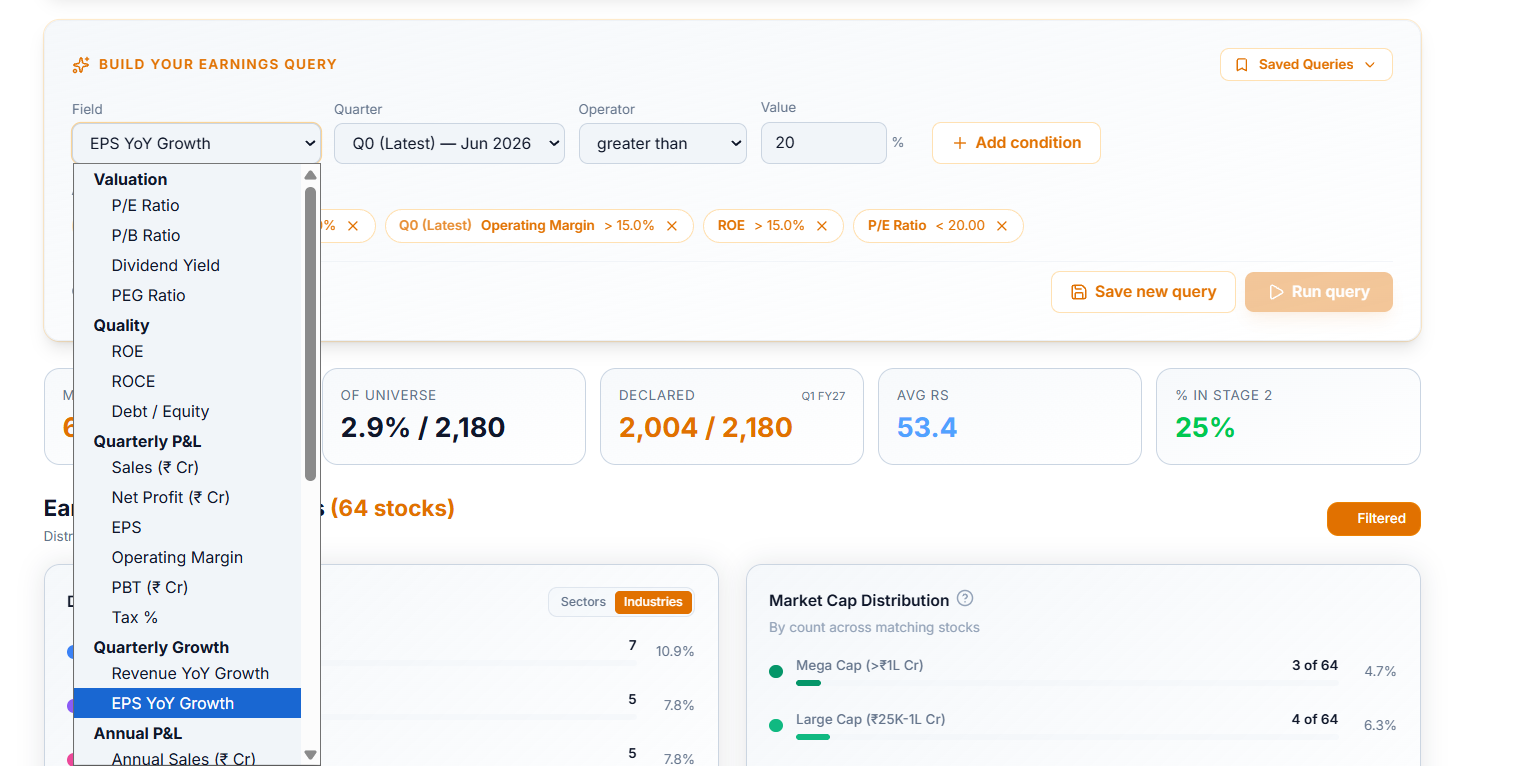
At the top, you build your query — pick a field, a quarter, an operator, and a value, and stack as many conditions as you need. Below that, summary stats tell you how many stocks matched, and two panels break those stocks down by sector, industry, and market-cap. Further down sits the results table itself, with its own filters and export options.
Common Questions
Where do I find this screen?
Open Analytics, then select Earnings in the sidebar, then Earnings Screen.
What fundamental ratios are available, and for how many stocks?
7–8 fundamental ratios (from P/E to PEG) are available, covering the large majority of the roughly 2,100 stocks on the platform — coverage is being actively expanded toward near-complete coverage, and remaining gaps are being filled progressively.
How can I filter stocks by fundamentals (e.g., EPS growth) combined with RS/Stage?
This screen is built exactly for that — set your fundamental constraints in the query builder, then use the Avg RS and % in Stage 2 summary stats, or the results table's own filters, to combine that with RS or Stage.