Finding the Strongest Sectors and Industries
The top stats and sector dropdown that show where strength sits.
Before working through individual industries one by one, it helps to know where strength is concentrated in the market as a whole. That's what the top of the Industry Analysis page is for.
Reading the Top Stats
Top WoW shows whichever industry gained the most relative strength over the past week. Top 5W shows the same over a five-week stretch.

Momentum shows how many industries are currently gaining strength versus losing it, across everything WealthLab tracks.
The Sector Dropdown
Sectors aren't listed as a separate table on this page — they sit inside a dropdown, ranked from strongest to weakest by relative strength. Opening it gives you the same broad read on where the market's strength currently sits, without needing to scroll through a full table.
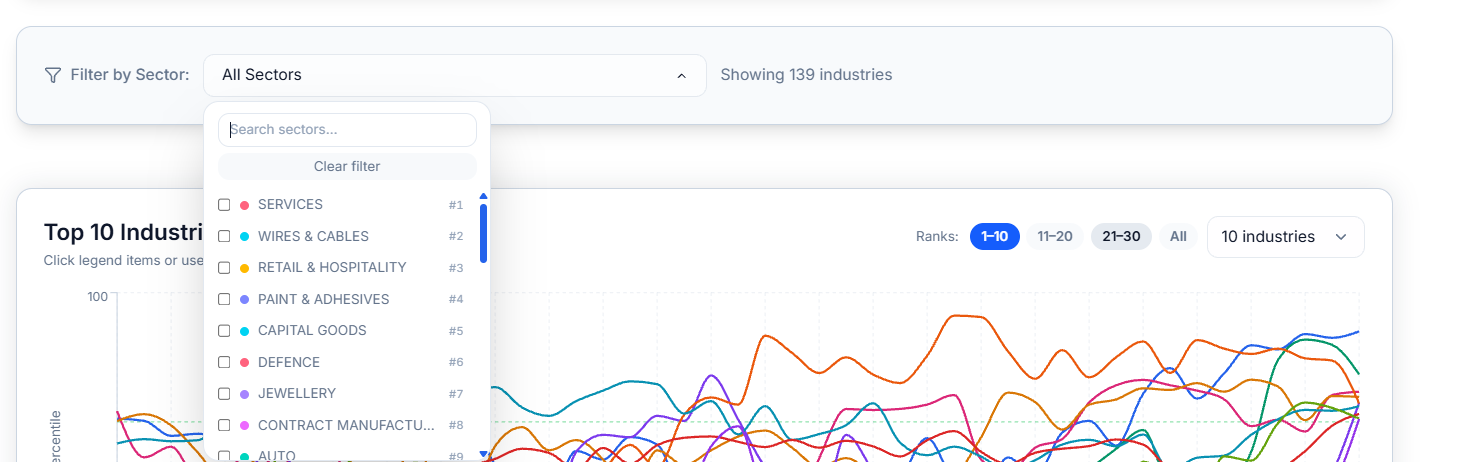
Selecting a sector from this dropdown is also how you move from the broad view into the narrower one — it filters the rest of the page down to just the industries inside that sector.
Common Questions
How do I find the leading sector and its industries?
Use the Top Stats and Sector Dropdown on this page — or refer to the video on finding leading sectors, available at www.wealthlab.in/courses under "Best Ways to Use WealthLab."
Does this ranking change often?
Yes — it reflects relative strength as it currently stands, so a sector's position can shift from one week to the next as conditions change.
Why do small industries (with only 3–4 stocks) look odd in average-based rankings?
When an industry has very few constituent stocks, the average RS or metric becomes less statistically meaningful — one company's move can skew the whole industry's number. For industries with 6 or more stocks, averages are a good gauge. For smaller industries, dig into the individual stocks to see what's actually driving the average.
Related Articles
What Is Industry Analysis? · Top Industries RS Trend Chart · Explore All Industries