Top Industries RS Trend Chart
Tracks how the strongest industries' relative strength moved over time.
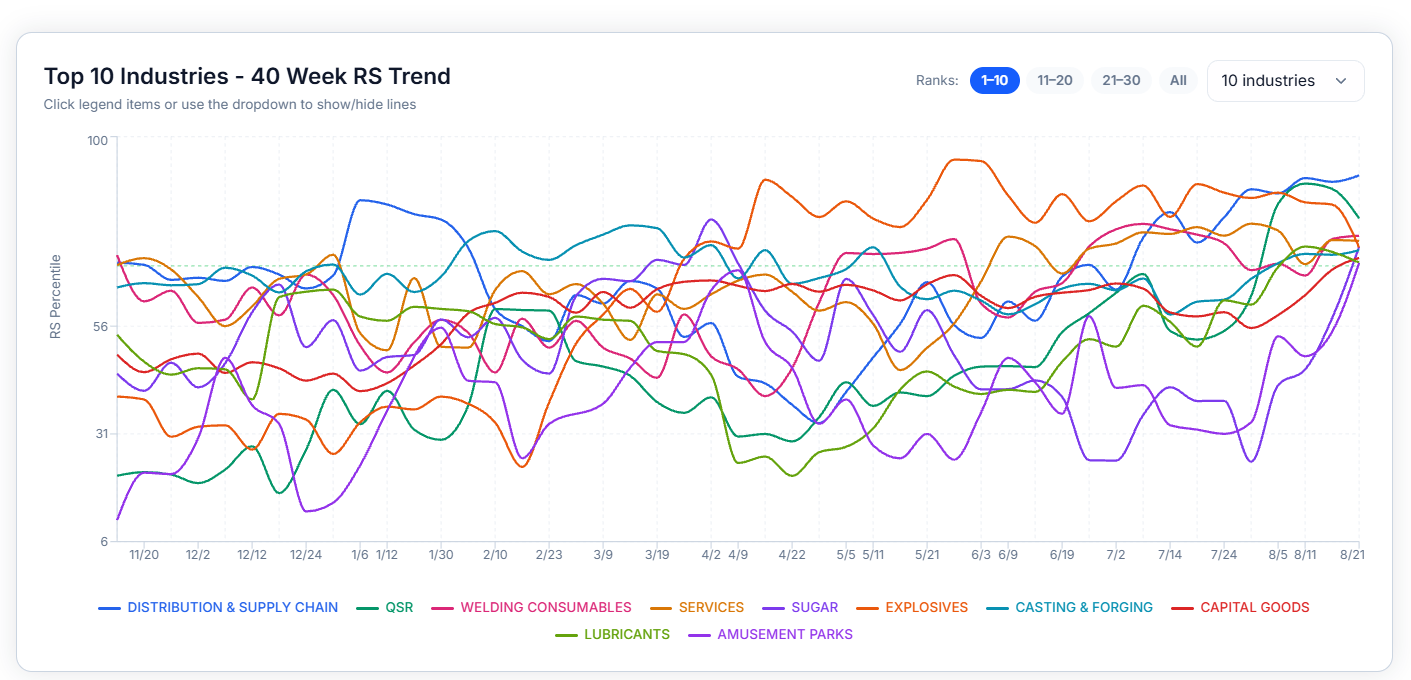
A ranking tells you where an industry stands today. This chart tracks how the strongest industries have moved over time and how they got there, rather than just showing where they stand today.
By default, it shows the top 10 industries at the current moment and how their strength has moved over the past 40 weeks.
How to Read It
Each line traces one industry's relative strength over 40 weeks. Watching the trend rather than a single snapshot reveals the journey of the industry.
An industry can hold a strong position for a stretch, but its relative strength might be falling with every passing week — a clear sign of strength being lost. The reverse is true for strength being gained.
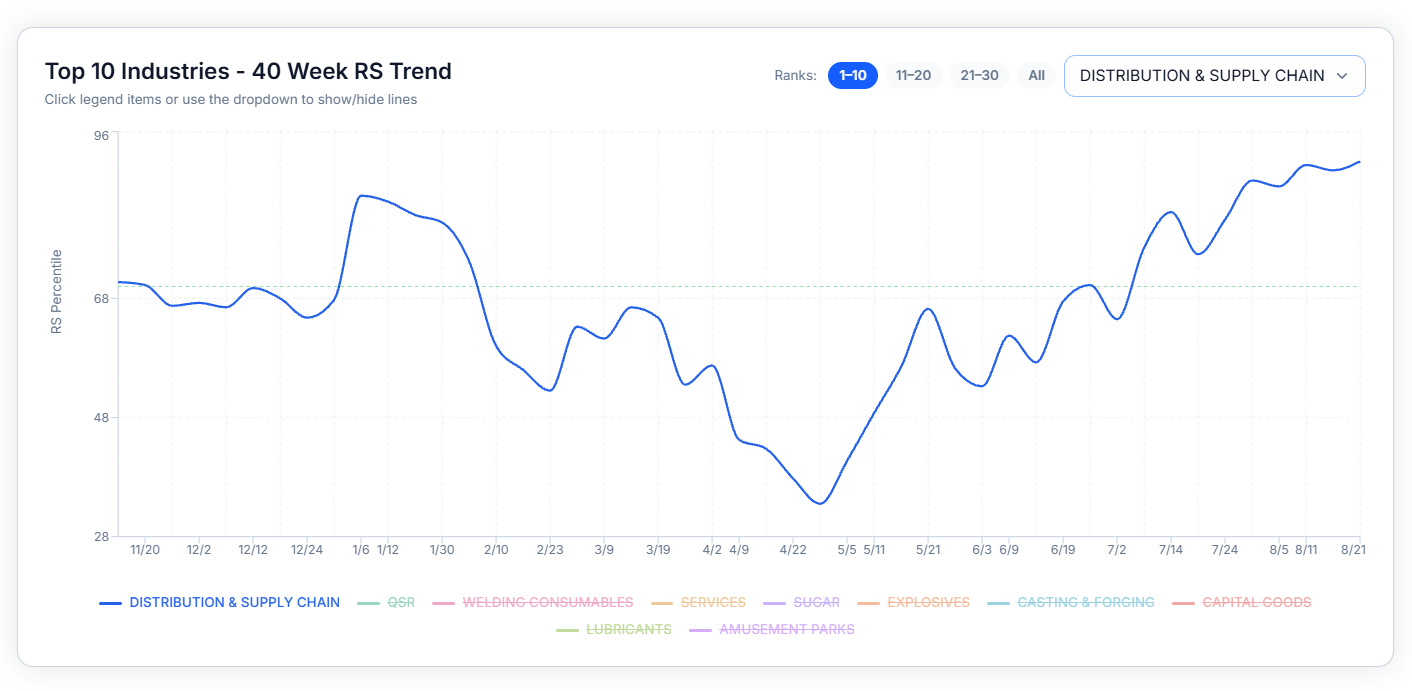
Toggle between Top 10, Top 20, and Top 30 to control how many industries are shown at once.
Common Questions
Can an industry that was leading months ago fall out of the top ranks later without anyone noticing right away?
Usually no — loss of strength is often gradual rather than sudden, which is exactly why tracking the trend over time is more informative than checking a ranking once and moving on.