The Breadth Tables
The MA Participation and Market Moves tables, explained.
On WealthLab, there are two tables that track daily breadth:
- The number of stocks above their 50/150/200 DMA, as well as,
- The number of stocks making 4% moves daily, or 10% moves weekly.
MA Participation Table
The MA Participation Table shows the percentage of stocks trading above their 50, 100, and 200-day moving averages. The table is color coded to mark improving or worsening conditions.
If conditions are improving versus their own history, the numbers are shown in green, while falling conditions show the numbers in red.

Market Moves Table
The Market Moves table shows counts of stocks making sharp moves — Daily ↑4%+ and Daily ↓4%+ in a single day, and 5-Day ↑10%+ and 5-Day ↓10% over five trading days.
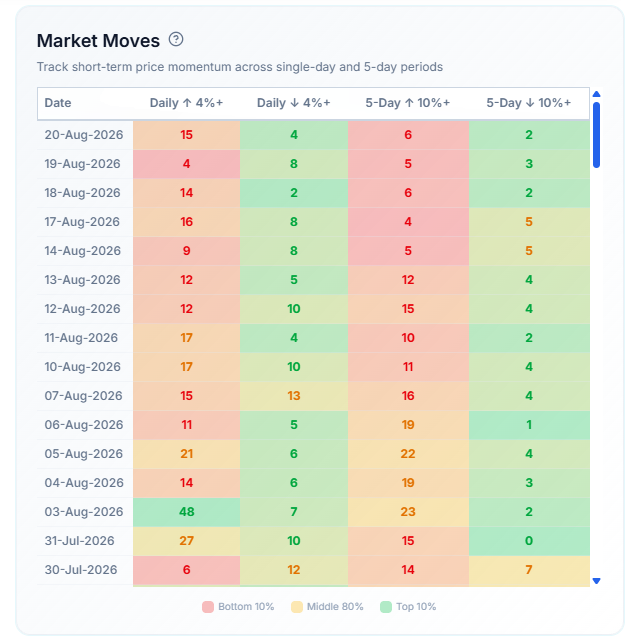
A large number of stocks showing up-moves is bullish for the market, while a large number of stocks showing down-moves shows a bearish market sentiment.