Log and Manage a Trade
Setting your capital, logging entries and exits, and recording your thesis.
Every trade in your journal is logged manually, and organized by the month it was entered. Before logging anything, though, your journal needs to know how much capital you're working with — everything else, like % Cap and PF Impact on your trades, is calculated against this number.
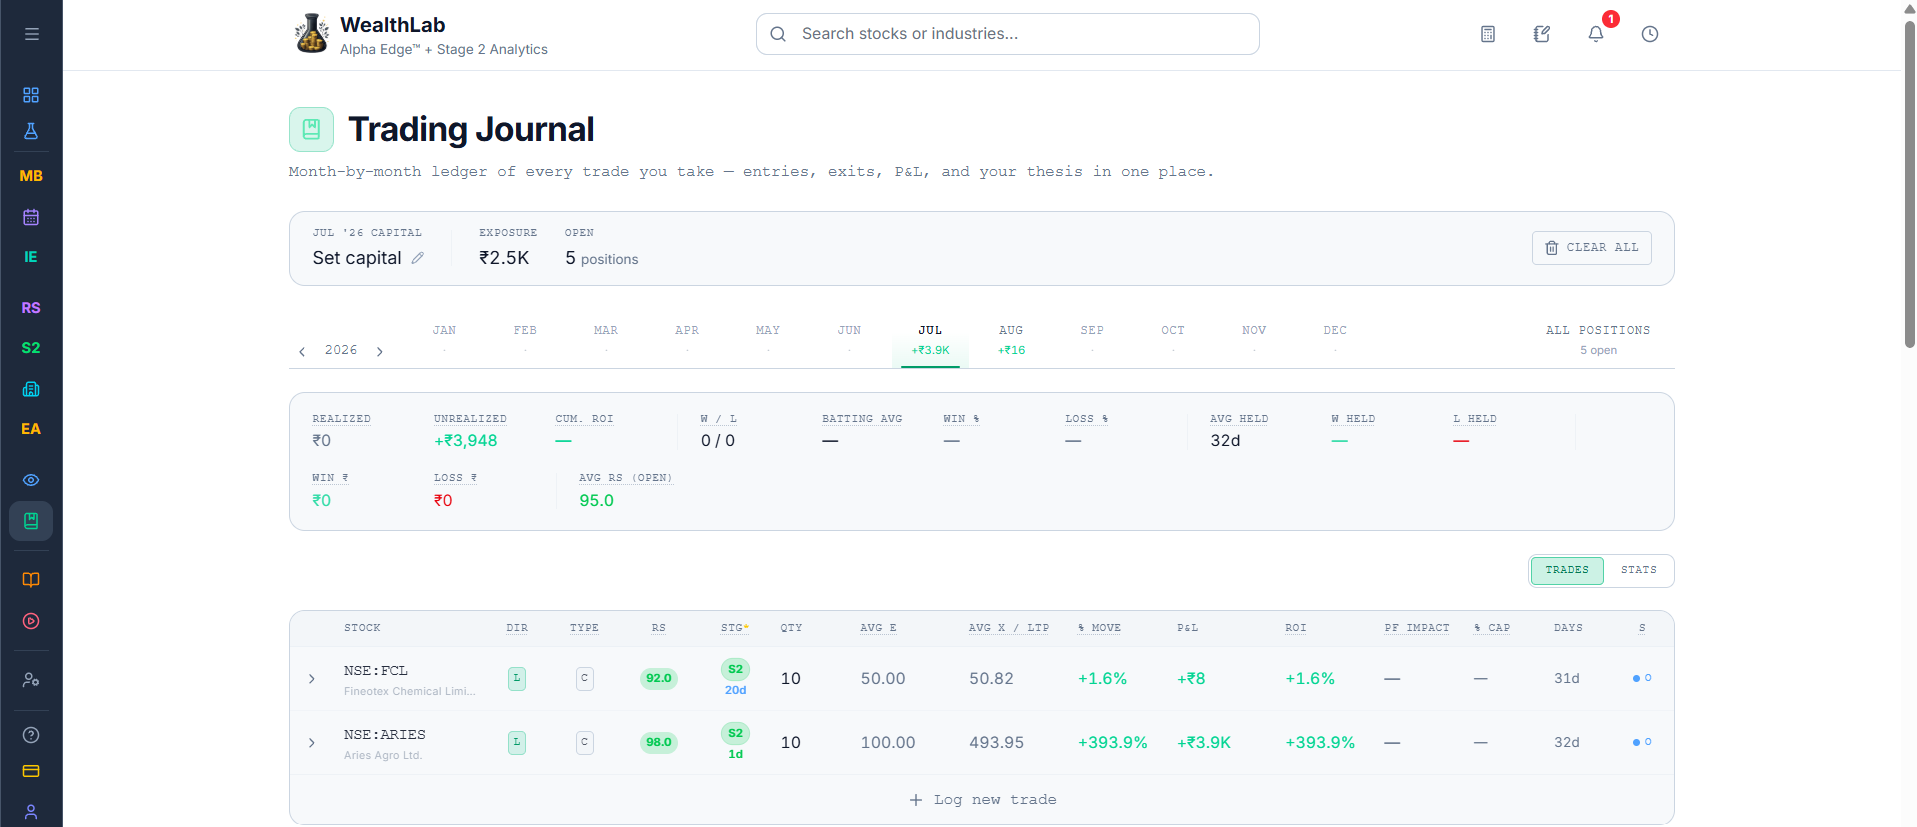
Setting Your Capital
Above the month selector sits a small summary bar with your Capital for that month. Select the pencil icon next to it to edit the amount you've set aside. This is set per month, so you can adjust it if your available capital changes from one month to the next.
This small summary bar contains:
- Capital — the capital you've set aside for that month, which you can edit directly using the pencil icon
- Exposure — how much of that capital is currently deployed across open positions
- Open — how many positions are currently open

Logging Your First Entry
Tap + Log new trade at the bottom of the table to add a new row. You'll fill in the trade's starting details directly in that row:
- Symbol — the stock, entered by name or ticker (e.g. INFY).
- Direction — Long, Short, or Neutral.
- Type — Cash or Fut (futures).
- Date — the date of this entry.
- Quantity — how many shares or contracts.
- Entry Price — the price you entered at.

Confirm the row, and it's added to the table for that month, with its own set of live stats.
What Shows Up Once a Trade Is Logged
Once a trade is in the table, its row starts tracking the stock's current RS, its Stage, and how many Days it's been logged, alongside your own numbers — Qty, Avg Entry, and the current price (Avg X / LTP).
From there, % Move, P&L, and ROI are calculated automatically based on where the stock is trading now against your entry.

Managing a Trade With Multiple Entries and Exits
A real trade is rarely just one buy and one sell. Select any row in the trades table to expand it. This opens the trade's own chart — with your entries and exits marked directly on it, alongside Stage 2 Entry/Exit and RS — plus two panels below it: Entries and Exits.
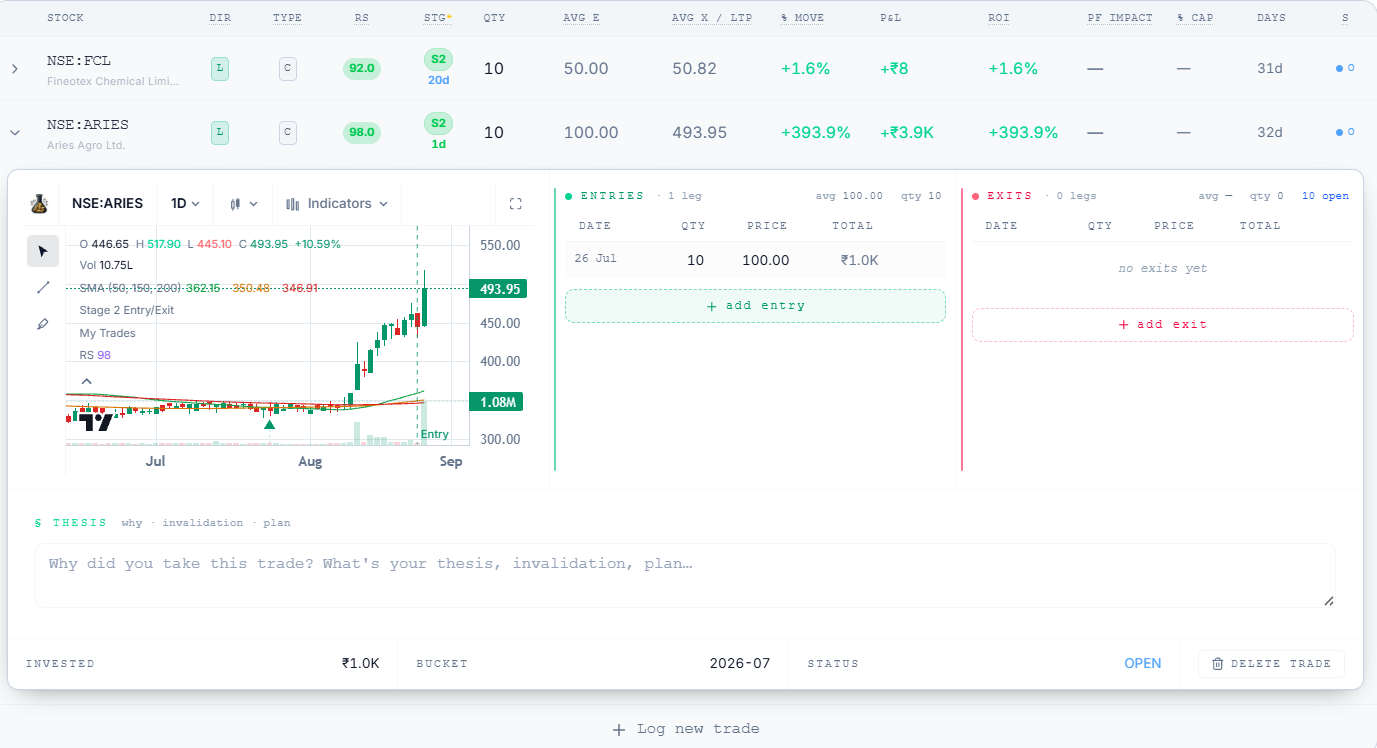
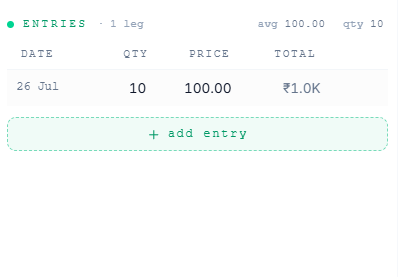
If you built into a position over more than one purchase, select + add entry in the Entries panel and log the date, quantity, and price for that additional leg. Each entry you add shows up as its own row, and the panel's avg and qty update to reflect your blended average across every entry, not just the first one.
When you sell out of part or all of a position, select + add exit in the Exits panel and log the date, quantity, and price for that exit. Until you log an exit, the panel shows no exits yet, and your full quantity shows as open. As you log exits, the panel's avg and qty update the same way the Entries panel does, and your position's open quantity shrinks accordingly.
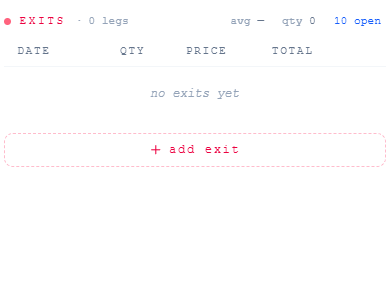
Every stat on the trade's row in the main table is built from what you've logged here. Adding an entry recalculates your Avg Entry across all legs. Logging an exit starts feeding into your realized P&L and ROI for the portion you've closed, while the remaining open quantity continues tracking against the current price. In other words, the summary row is a live reflection of exactly what you've logged in these two panels — nothing is calculated from anywhere else.
Recording Your Thesis
Below the entries and exits sits a Thesis section, with three tabs — why, invalidation, and plan. Use this to write down why you took the trade, what would prove it wrong, and what your plan is, so you have your own reasoning on record to look back on later.

Moving Between Months
The row of months (Jan–Dec) under the summary bar lets you switch which month's trades you're looking at. Each month shows its realized P&L right on the tab — green for a profitable month, red for a loss, and a dash if you didn't log any trades that month. Use the arrows next to the year to move to a different year. All Positions, on the far right, shows every currently open position regardless of which month it was entered in.

Clearing Your Journal
Clear All removes every trade from your journal. This can't be undone, so it's worth being sure before using it — there's no per-month clear, only clearing everything at once.
Common Questions
Where can I see what all these stats and columns actually mean?
Each column has a tooltip explaining it directly in the table, and the full breakdown lives on the stats page dedicated to this — see that article for how to read your monthly stats in depth.
How do I track corporate bonuses or splits in the Journal?
For a bonus, add a new entry at a purchase price of roughly ₹0 (use ₹0.01 or ₹1 if the platform rejects exactly 0) — this automatically adjusts your average price and returns. For a split, manually adjust your entry in retrospect — for example, if you bought 500 shares at ₹100 each and the stock later splits 1:2, edit the entry to 1,000 shares at ₹50 each (same total invested amount).
Related Articles
What Is the Trading Journal? · Trading Journal Table · What Do My Trading Journal Stats Mean?