Trading Journal Table
What each column in the trade table means.
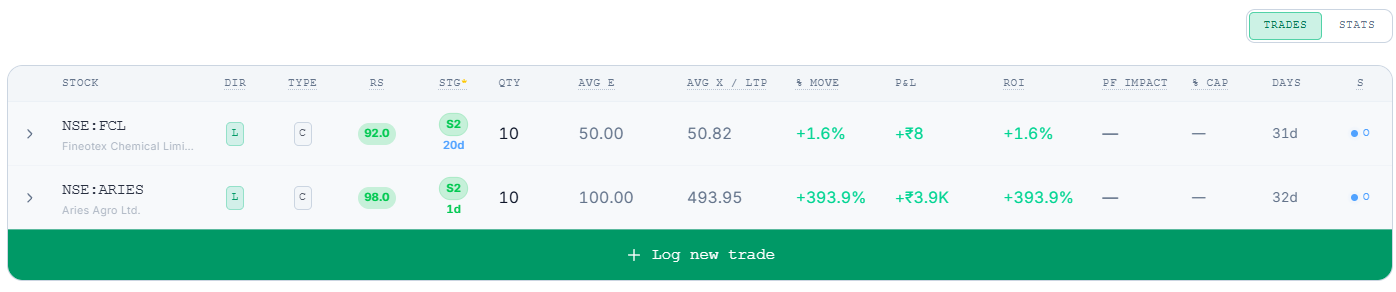
Each row in the table is one logged trade, with its live performance tracked alongside the details you entered.
Reading the Columns
- Stock — the ticker and company name
- Dir — direction: L for long, S for short
- Type — the kind of trade, such as C for cash (delivery) or F for F&O
- RS — the stock's current RS Percentile
- Stg — its current Stage, along with how many days it's held that Stage
- Qty — quantity traded
- Avg E — your average entry price
- Avg X / LTP — your average exit price if closed, or the current market price (LTP) if the position is still open
- % Move — the percentage price move from entry to exit (or to LTP, if open)
- P&L — profit or loss on the trade in rupees
- ROI — return on the capital used for that trade
- PF Impact — how much this trade has moved your overall portfolio, as a percentage
- % Cap — how much of your set capital this trade represents
- Days — how long the position has been (or was) held
- S — status: a C marks a closed trade, a dot with O marks one still open
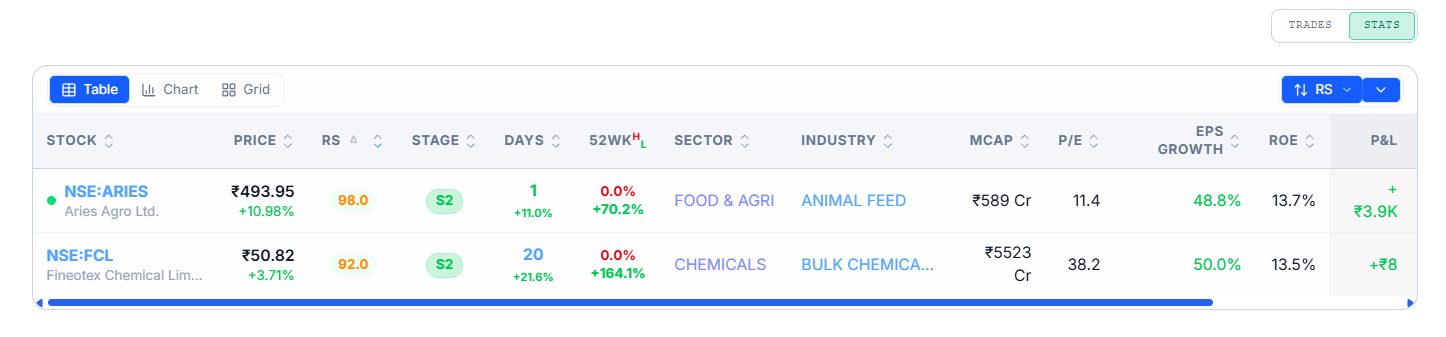
Switching to Stats View
The Trades / Stats toggle above the table switches between the trade-by-trade table described above and a stats-focused view — see What Do My Trading Journal Stats Mean? for what those numbers cover.
Common Questions
Why does a closed trade still show a % Move and P&L?
Those figures are locked in at the point of exit — once a trade is closed, its P&L reflects the actual entry and exit prices you logged, not the current market price.
What's the difference between ROI and PF Impact?
ROI measures the return on that one trade's own capital. PF Impact measures how much that trade moved your overall portfolio — a small trade can have a high ROI but barely register on PF Impact, and vice versa.
Related Articles
What Is the Trading Journal? · Log and Manage a Trade · What Do My Trading Journal Stats Mean?