Breadth & Momentum
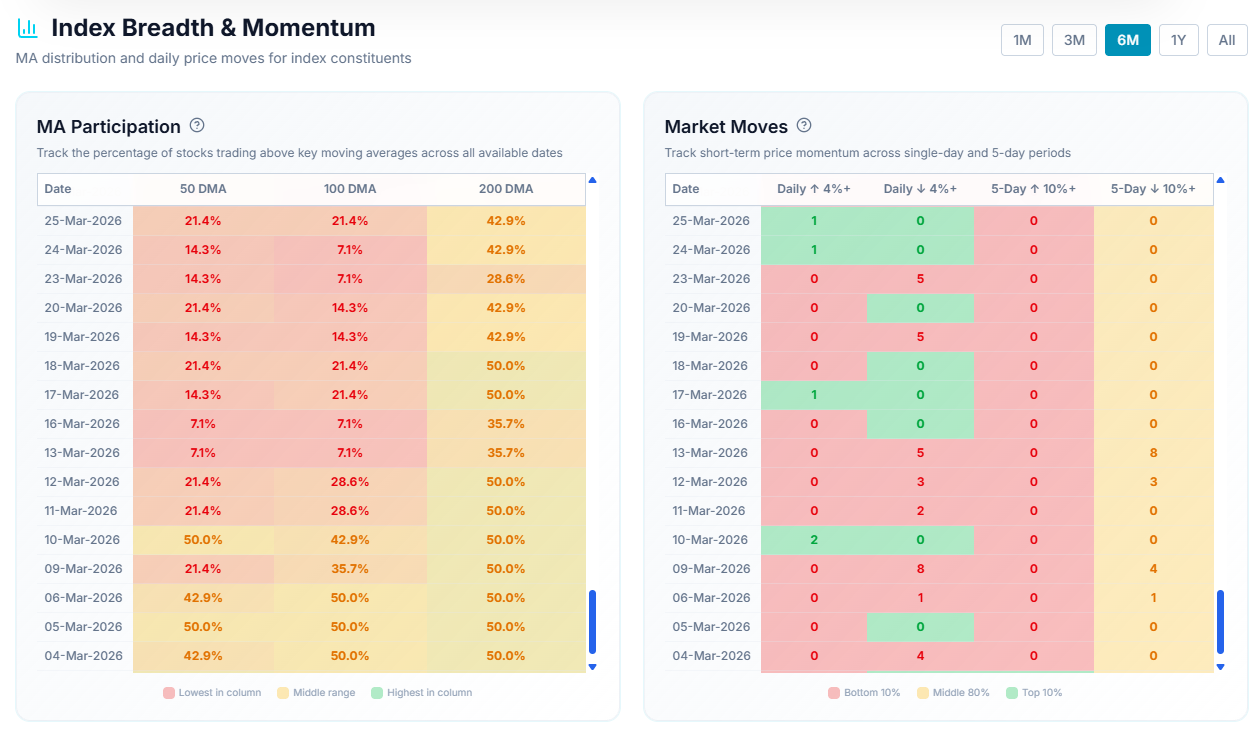
MA Participation and sharp-move counts, scoped to this index.
Was this helpful?
This section applies the same breadth tracking you'd see market-wide, scoped down to just this index's constituents.
MA Participation
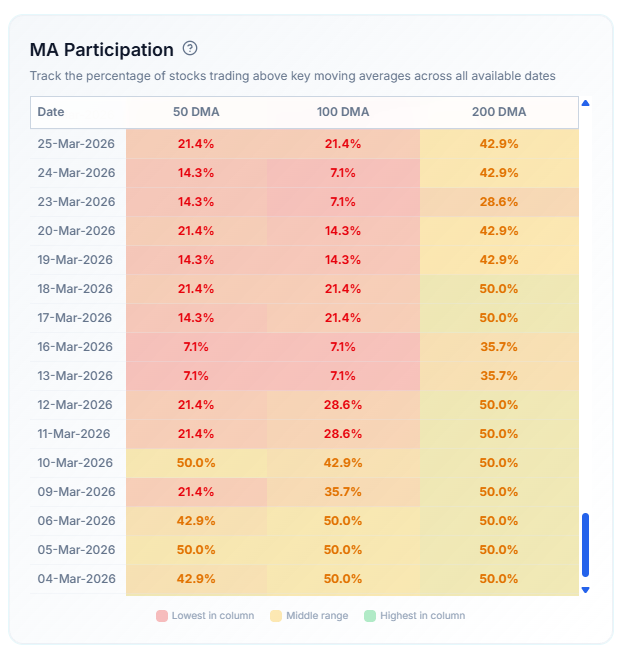
Shows the percentage of the index's constituent stocks trading above their 50, 100, and 200-day moving averages. An improving index breadth is reflected in green, while red shows that the breadth is declining.
Market Moves
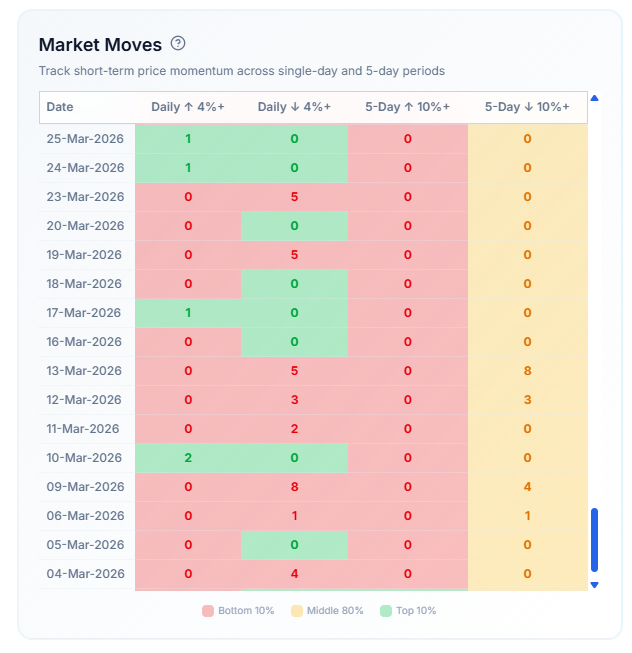
Shows counts of the index's constituents making sharp moves — Daily ↑4%+, Daily ↓4%+, and the same over a 5-Day stretch. Both tables share a timeframe control (1M through All).
Related Articles
RS Trend and Rate of Change Charts · Index vs NSE500 Chart · Comparing Stocks Within an Index