Price Chart
The index's own tradeable price chart, with Stage and RS entries marked.
An individual index has its own tradeable price — so this page includes a full price chart for the index itself.
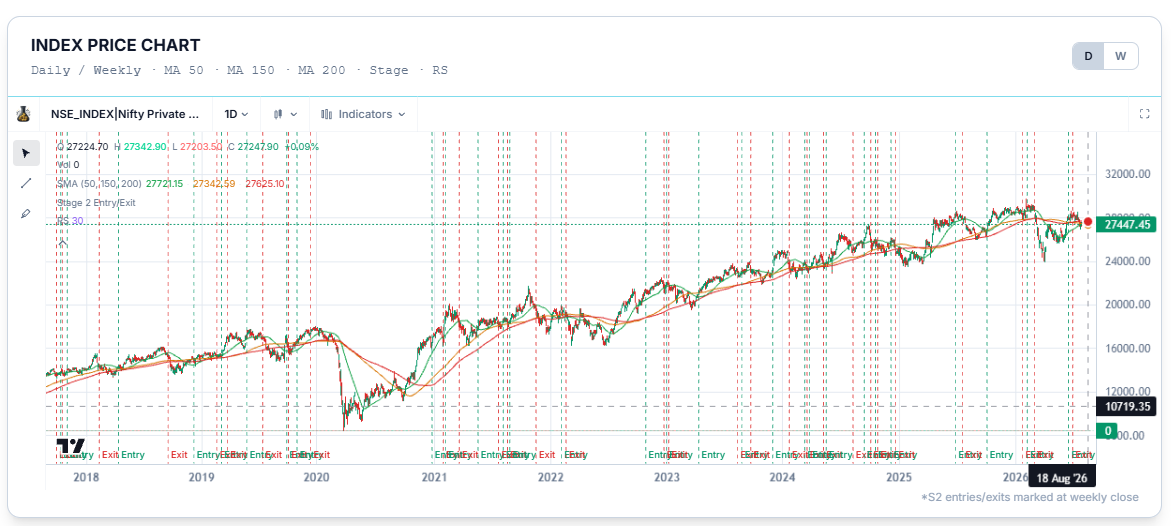
Reading the chart
This works the same way as the price chart on any stock's page — candlesticks by default, switchable between Daily and Weekly, with moving averages (MA 50, MA 150, MA 200) plotted over price. Stage and RS entries are marked directly on the chart, so you can see exactly when the index itself moved into or out of Stage 2 alongside its price history.
Common Questions
Does the index itself get classified into a Stage, separate from its constituent stocks?
Yes — the chart marks Stage 2 entries and exits for the index as a whole, which is a separate thing from what share of its constituents happen to be in Stage 2.
Related Articles
Index at a Glance · RS Trend and Rate of Change Charts · Breadth & Momentum