Breadth and Momentum
MA Participation and sharp-move counts, scoped to this industry.
This section helps you track the breadth and the participation of the stocks of that industry in the industry's performance.
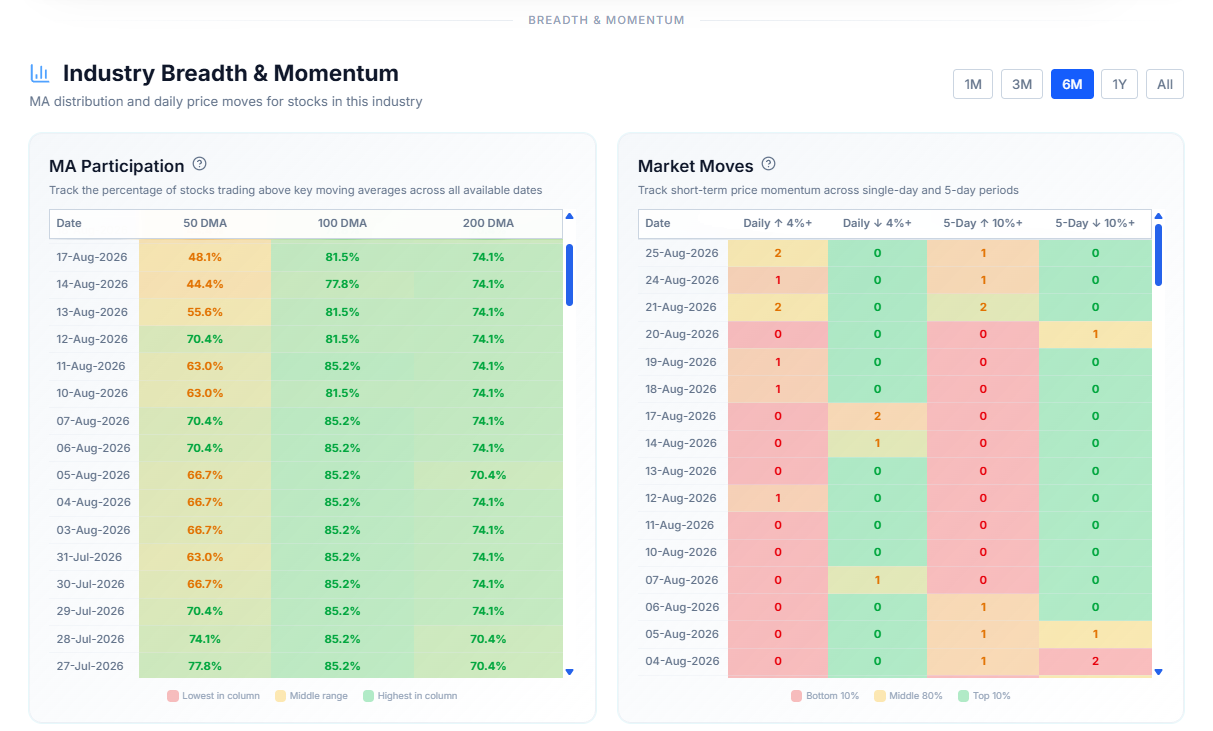
MA Participation
Shows the percentage of the industry's stocks trading above their 50, 100, and 200-day moving averages. An improving industry breadth is reflected in green, while red shows that the breadth is declining.
This is one of the fastest ways to gauge how healthy participation is across the industry, rather than judging it off a handful of the biggest names. If 80% of the industry's stocks are trading above their 200-day average, that's broad strength — most of the industry is genuinely participating in the move, not just one or two large stocks carrying the average. If that number drops to 20%, the industry might still look fine on a price chart because of a couple of big movers, while most of its stocks are quietly struggling underneath.
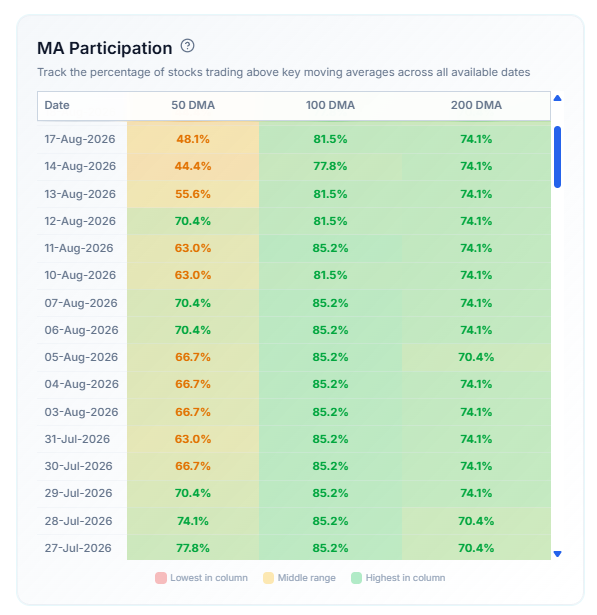
Market Moves
Shows counts of the industry's stocks making sharp moves — Daily ↑4%+, Daily ↓4%+, and the same over a 5-Day stretch. Both tables share a timeframe control (1M through All).
This tells you how much sharp, single-stock movement is happening inside the industry right now — separate from its overall trend. An industry can be drifting sideways on average while a handful of its stocks are swinging hard day to day, and this is where you'd actually see that. A sudden spike in the number of stocks moving 4%+ in a day can also be an early sign that something's shifting across the industry before it shows up in the slower-moving averages.
Common Questions
How is this different from the market-wide MA Participation and Market Moves tables?
Same idea, same columns — just scoped down to only the stocks inside this one industry, instead of every stock in the market. Market-wide data tells you what's happening across the whole market; this tells you the same thing, but zoomed into just this industry.
Related Articles
Industry at a Glance · RS Trend and Rate of Change Charts · Quarterly Earnings Trends