Quarterly Earnings Trends
Sales, PAT, and EPS growth across the industry's companies.
This section shows how the companies inside an industry have actually been performing, quarter over quarter.
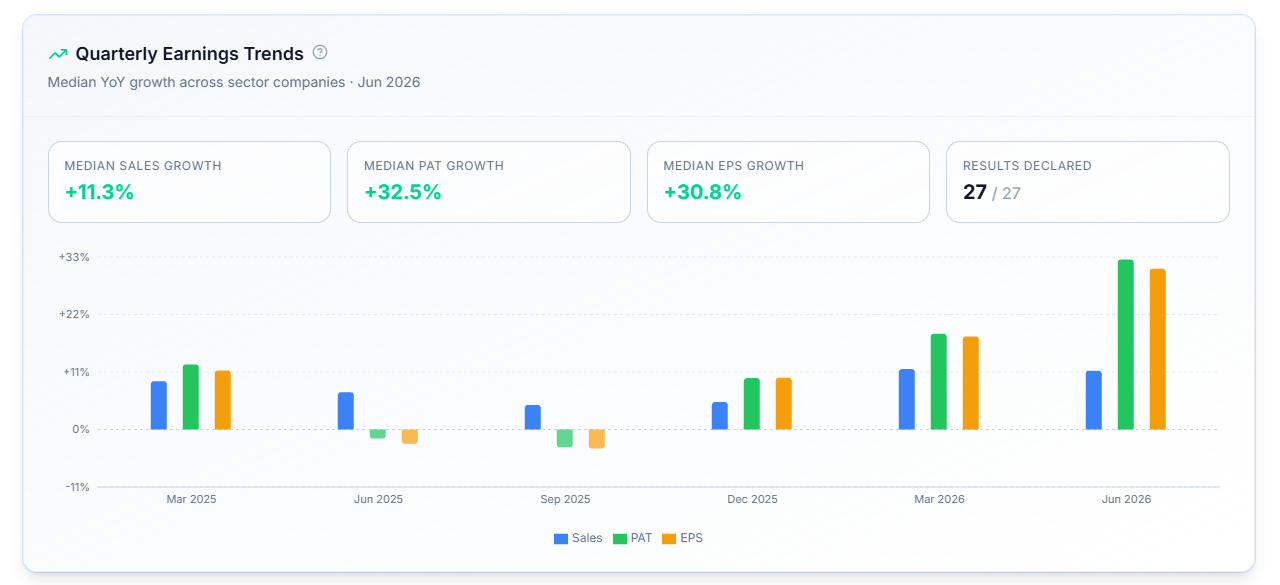
The Summary Figures

Sales Growth measures how much a company's revenue has grown compared to the same quarter last year. It's the most basic sign of whether a business is actually expanding — money coming in the door is the foundation everything else is built on.
PAT Growth measures growth in Profit After Tax — what the company actually kept after every expense, interest payment, and tax. This is where you see whether growing sales are actually translating into profit, or getting eaten up along the way.
EPS Growth measures growth in Earnings Per Share — profit divided across each share of the company. This matters slightly differently than PAT growth, because a company can grow its total profit while EPS barely moves, if it's also issued a lot of new shares along the way.
Median Sales Growth, Median PAT Growth, and Median EPS Growth show year-over-year change across the industry's companies for the most recently reported quarter, alongside Results Declared, showing how many of the industry's stocks have reported so far.
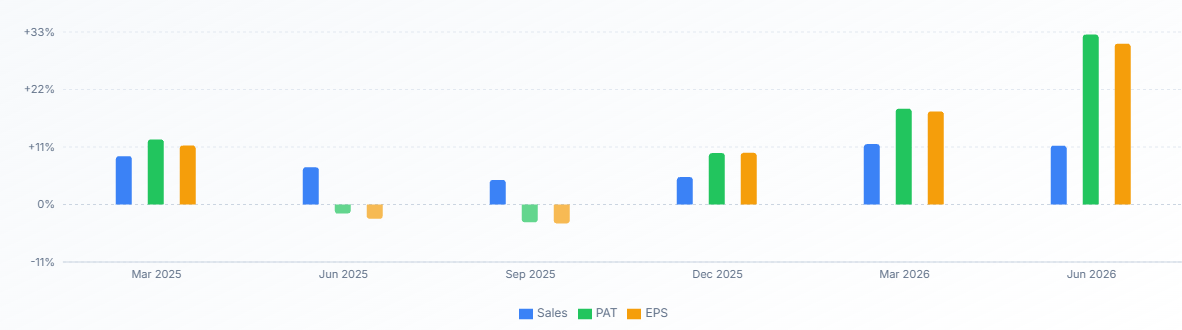
The Trend Charts
Plots Sales, PAT, and EPS growth side by side for each of the last several quarters, so you can see whether earnings momentum across the industry is building or fading over time, rather than judging it off a single quarter.
Common Questions
Why use the median instead of an average here too?
If we used average, a handful of very large earnings swings at individual companies would distort the industry-wide read — the median prevents that from happening.
Does this cover every stock in the industry, or just some of them?
It covers all of the industry's companies — Results Declared tells you how many have actually reported the current quarter so far.
Related Articles
What Is an Industry Page? · Industry at a Glance · Breadth and Momentum